What's new in Garage Hive - September '20 Roundup (Power BI special)
During September we started the rollout of the latest platform to our customers which saw lots of additional features available. To learn more about the new features available in the platform update please visit Major Platform Update Preview & the August Roundup.
In this Roundup, we are very excited to preview our new Power BI app which will be available in October. The new app has been re-designed and built from scratch, this has made the app much more efficient and in some cases, it has reduced the data refresh times by 75%.
During the re-design, we were able to structure the data in such a way that enabled us to make reports and apply filters that weren’t previously possible. Another important part of the re-design was to make sure the app is easier to navigate, especially for new Power BI users.
The new app currently consists of 50 re-designed reports, 3 new embed reports and a new navigation menu.
Please find a list of some of the more significant changes to the app below.
New Reports added to the app.
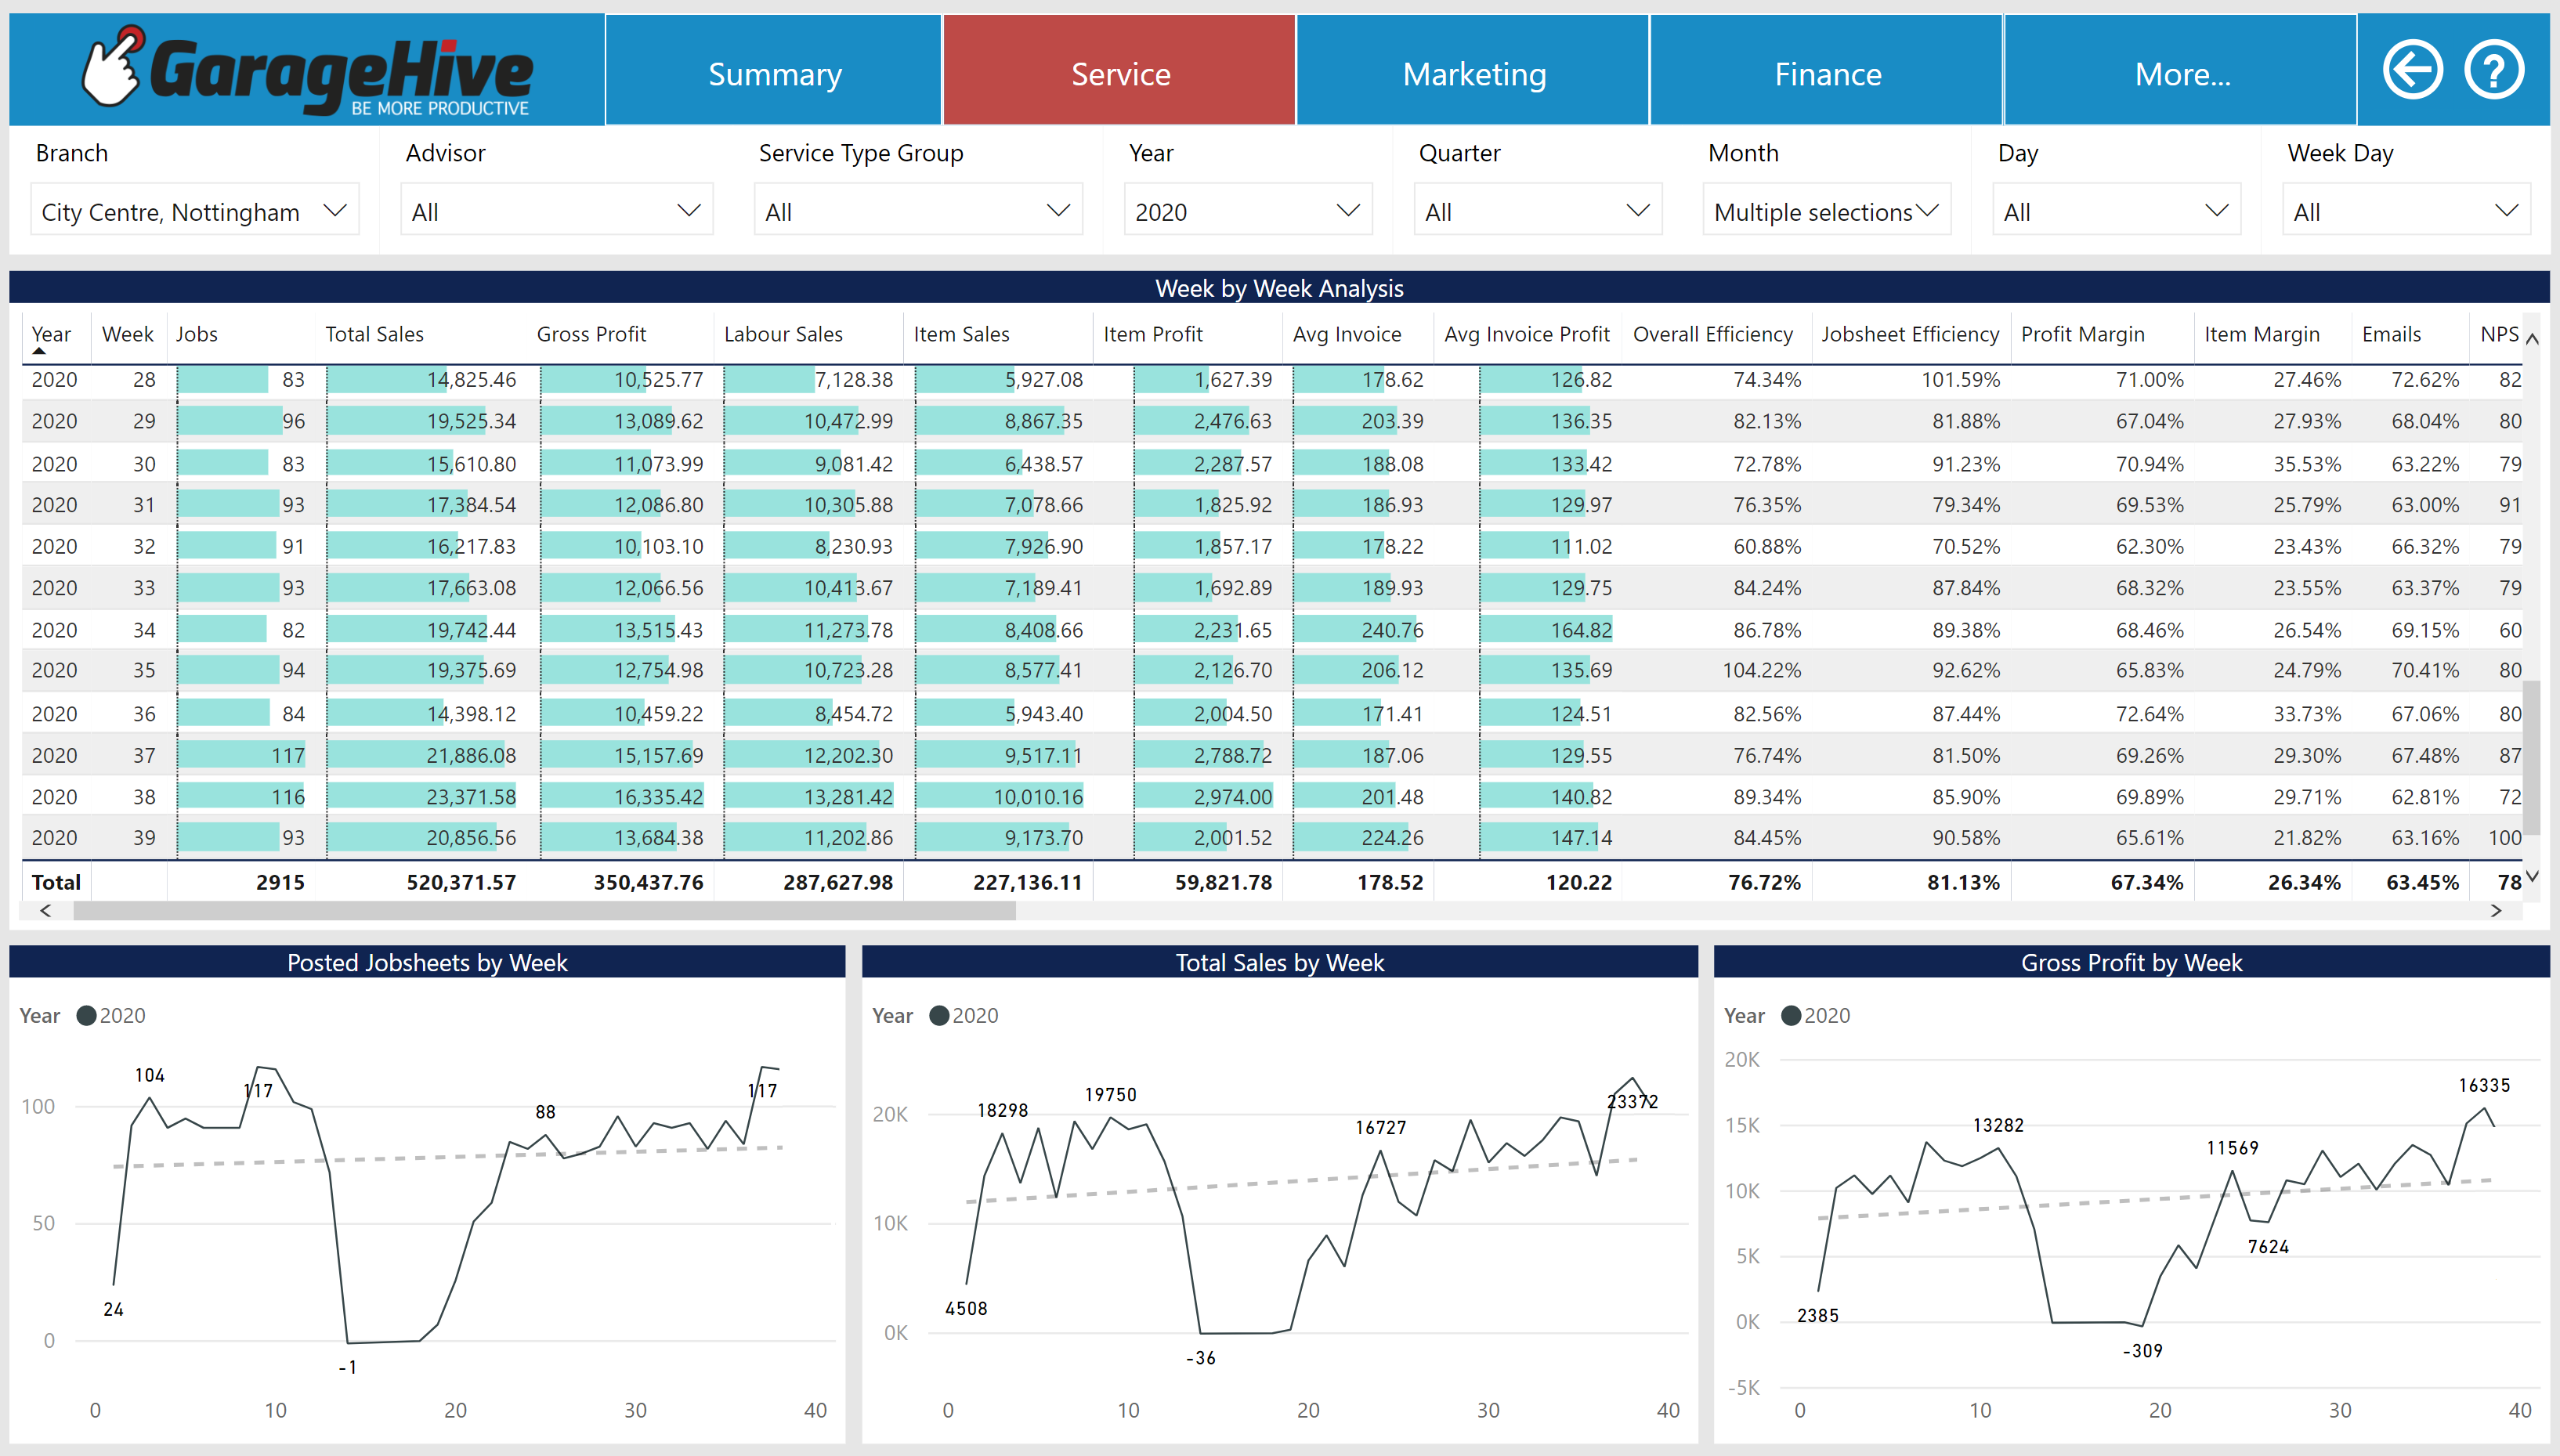
- Weekly Analysis – Added the ability to view key KPIs on a week by week basis.
- Service Type Analysis – View key KPIs per service type, such as profit margin, gross profit, efficiency, and average invoice values. This data is critical to pinpoint where specific improvements to your business can be made.
- Branch Analysis – Multi-site companies can now compare the key KPIs of each branch side by side.
- Vehicle Make, Vehicle Model and Engine Code Analysis all now have their own separate reports, allowing detailed analysis of each. Understand the efficiencies and margins of the types of vehicles in your workshop.
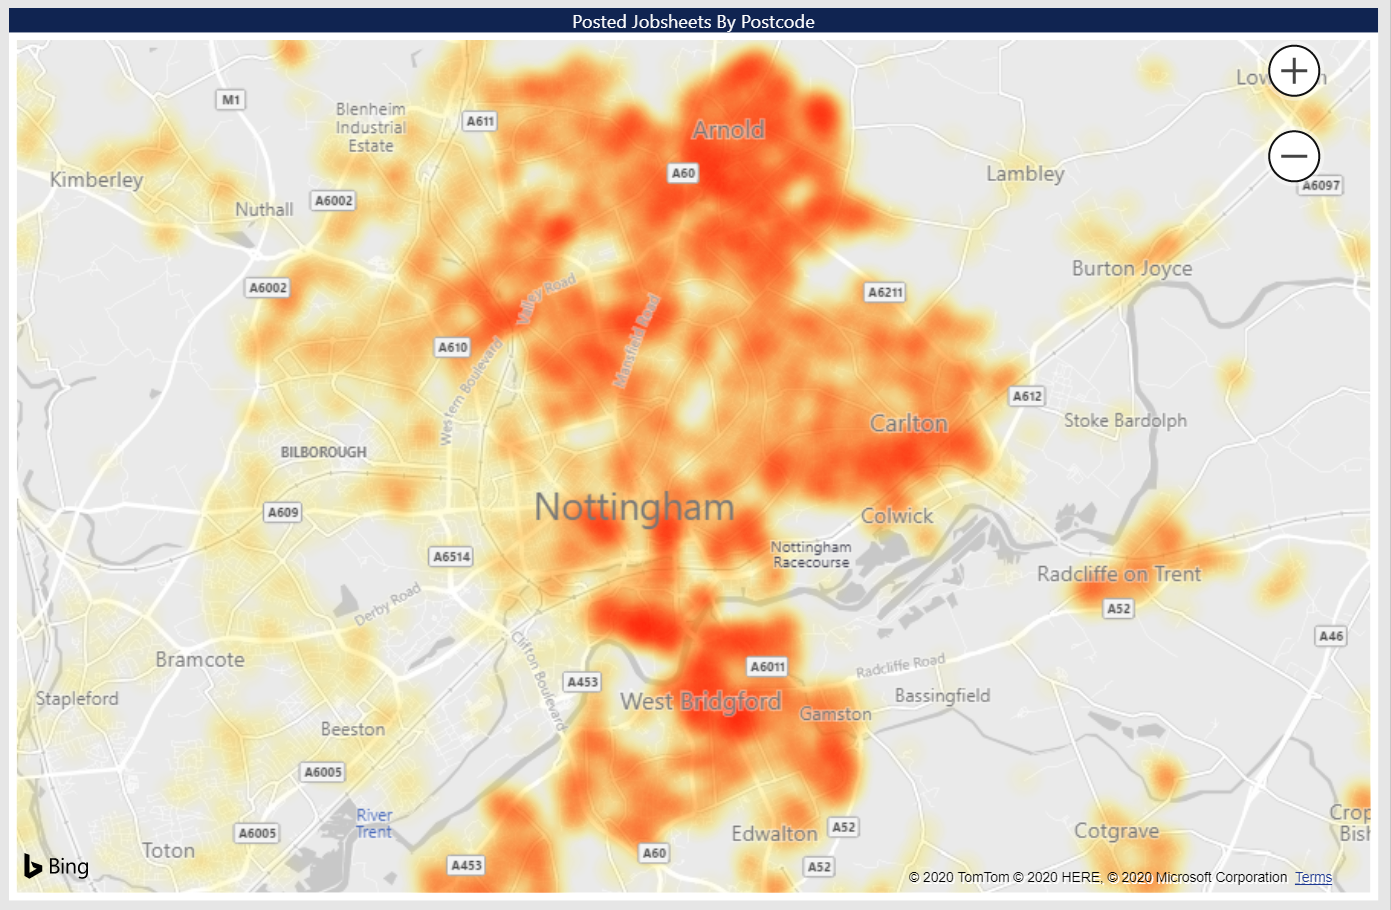
- Postcode Analysis – Understand the key KPIs of your customer postcodes and cities.
- Customer performance and Account customer performance – Two separate reports now allow you to analyse the key KPIs such as efficiency, margin and gross profit per customer and account customer.
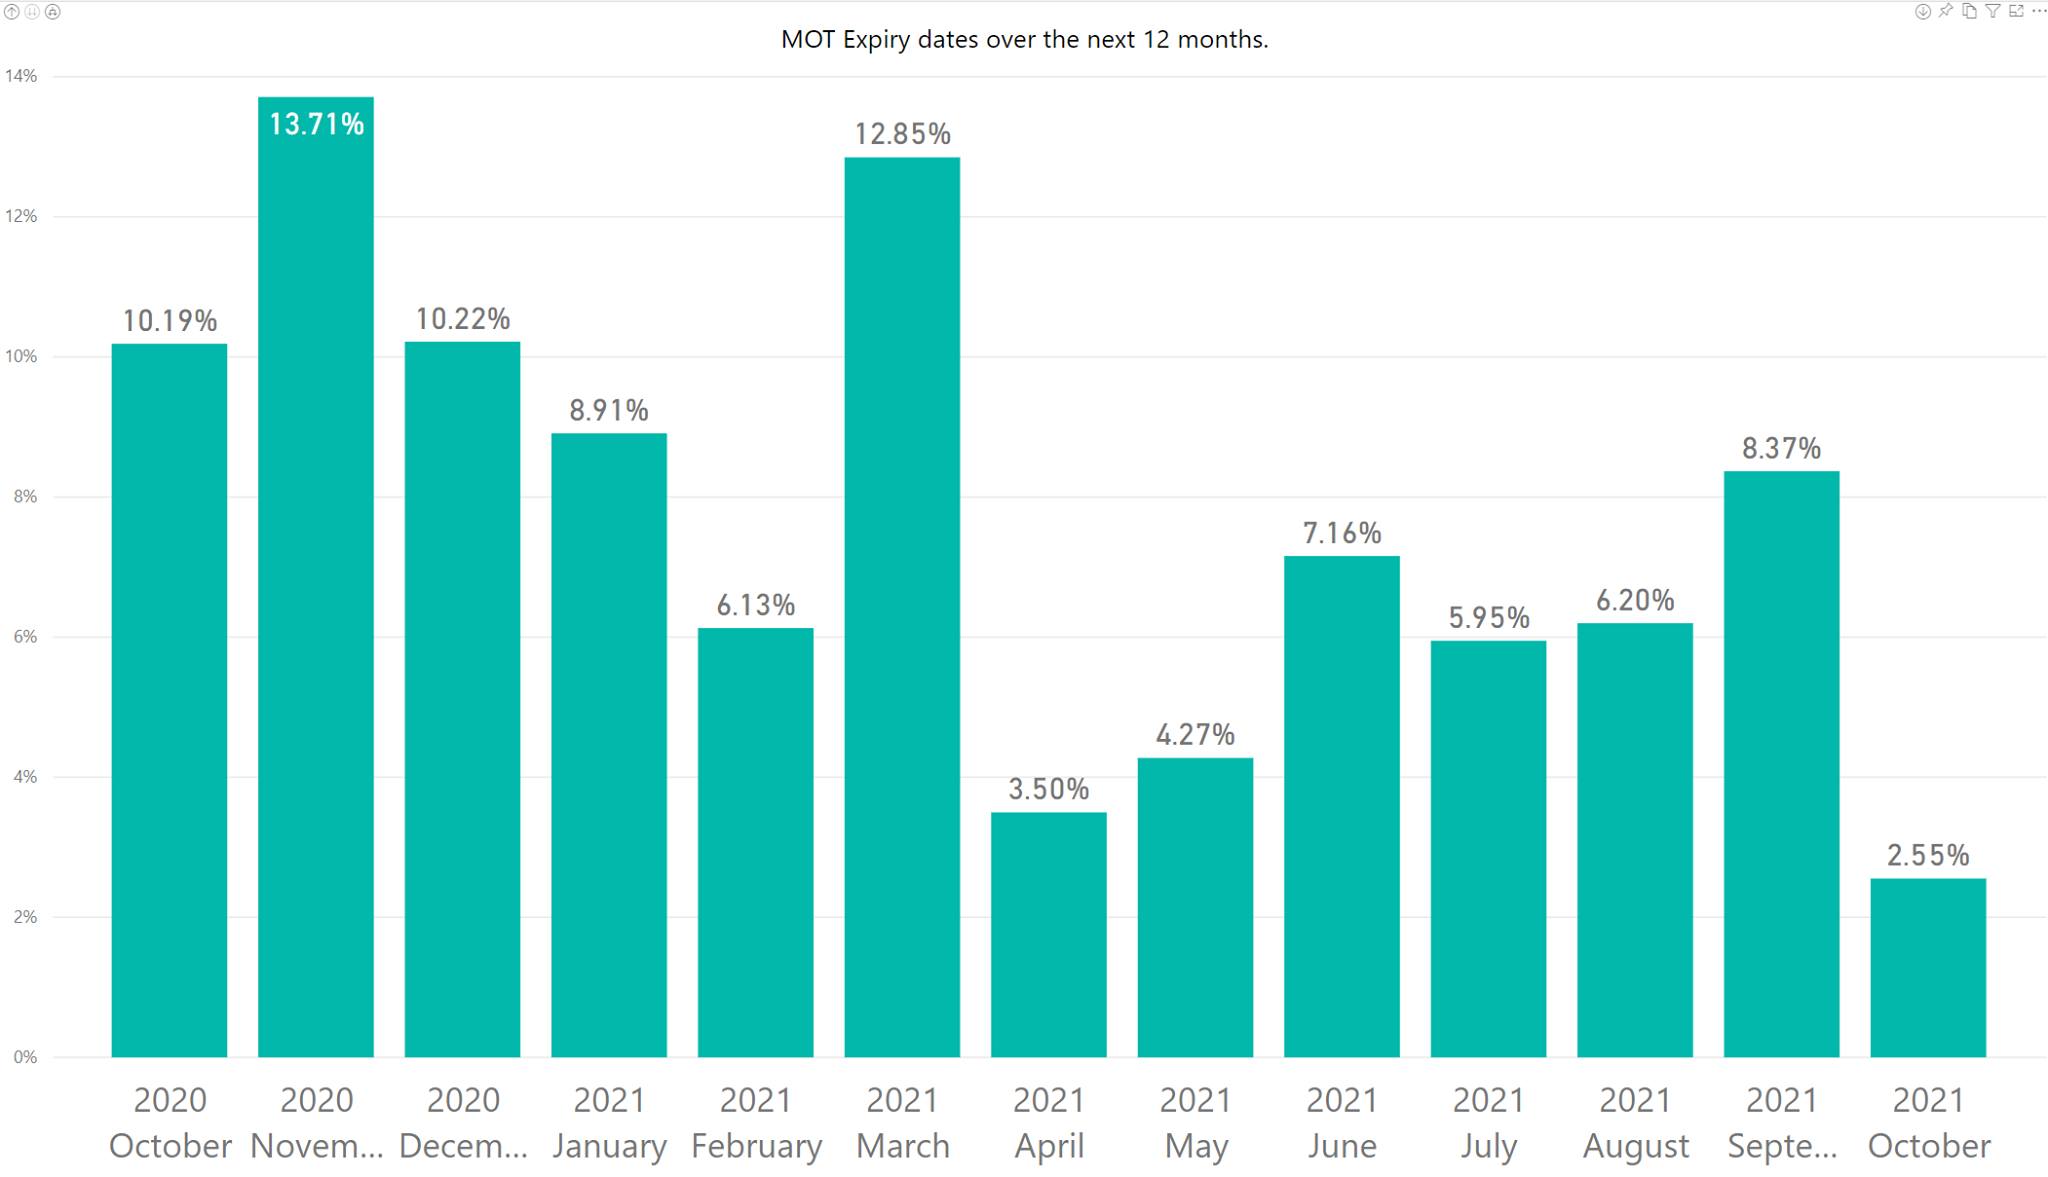
- MOT Reminders – This report allows you to analyse your future MOT reminders, giving you a chance to identify busy or potential quiet periods in your business.
- Service Reminders – This report allows you to analyse your future Service reminders, giving you a chance to identify busy or potential quiet periods in your business.
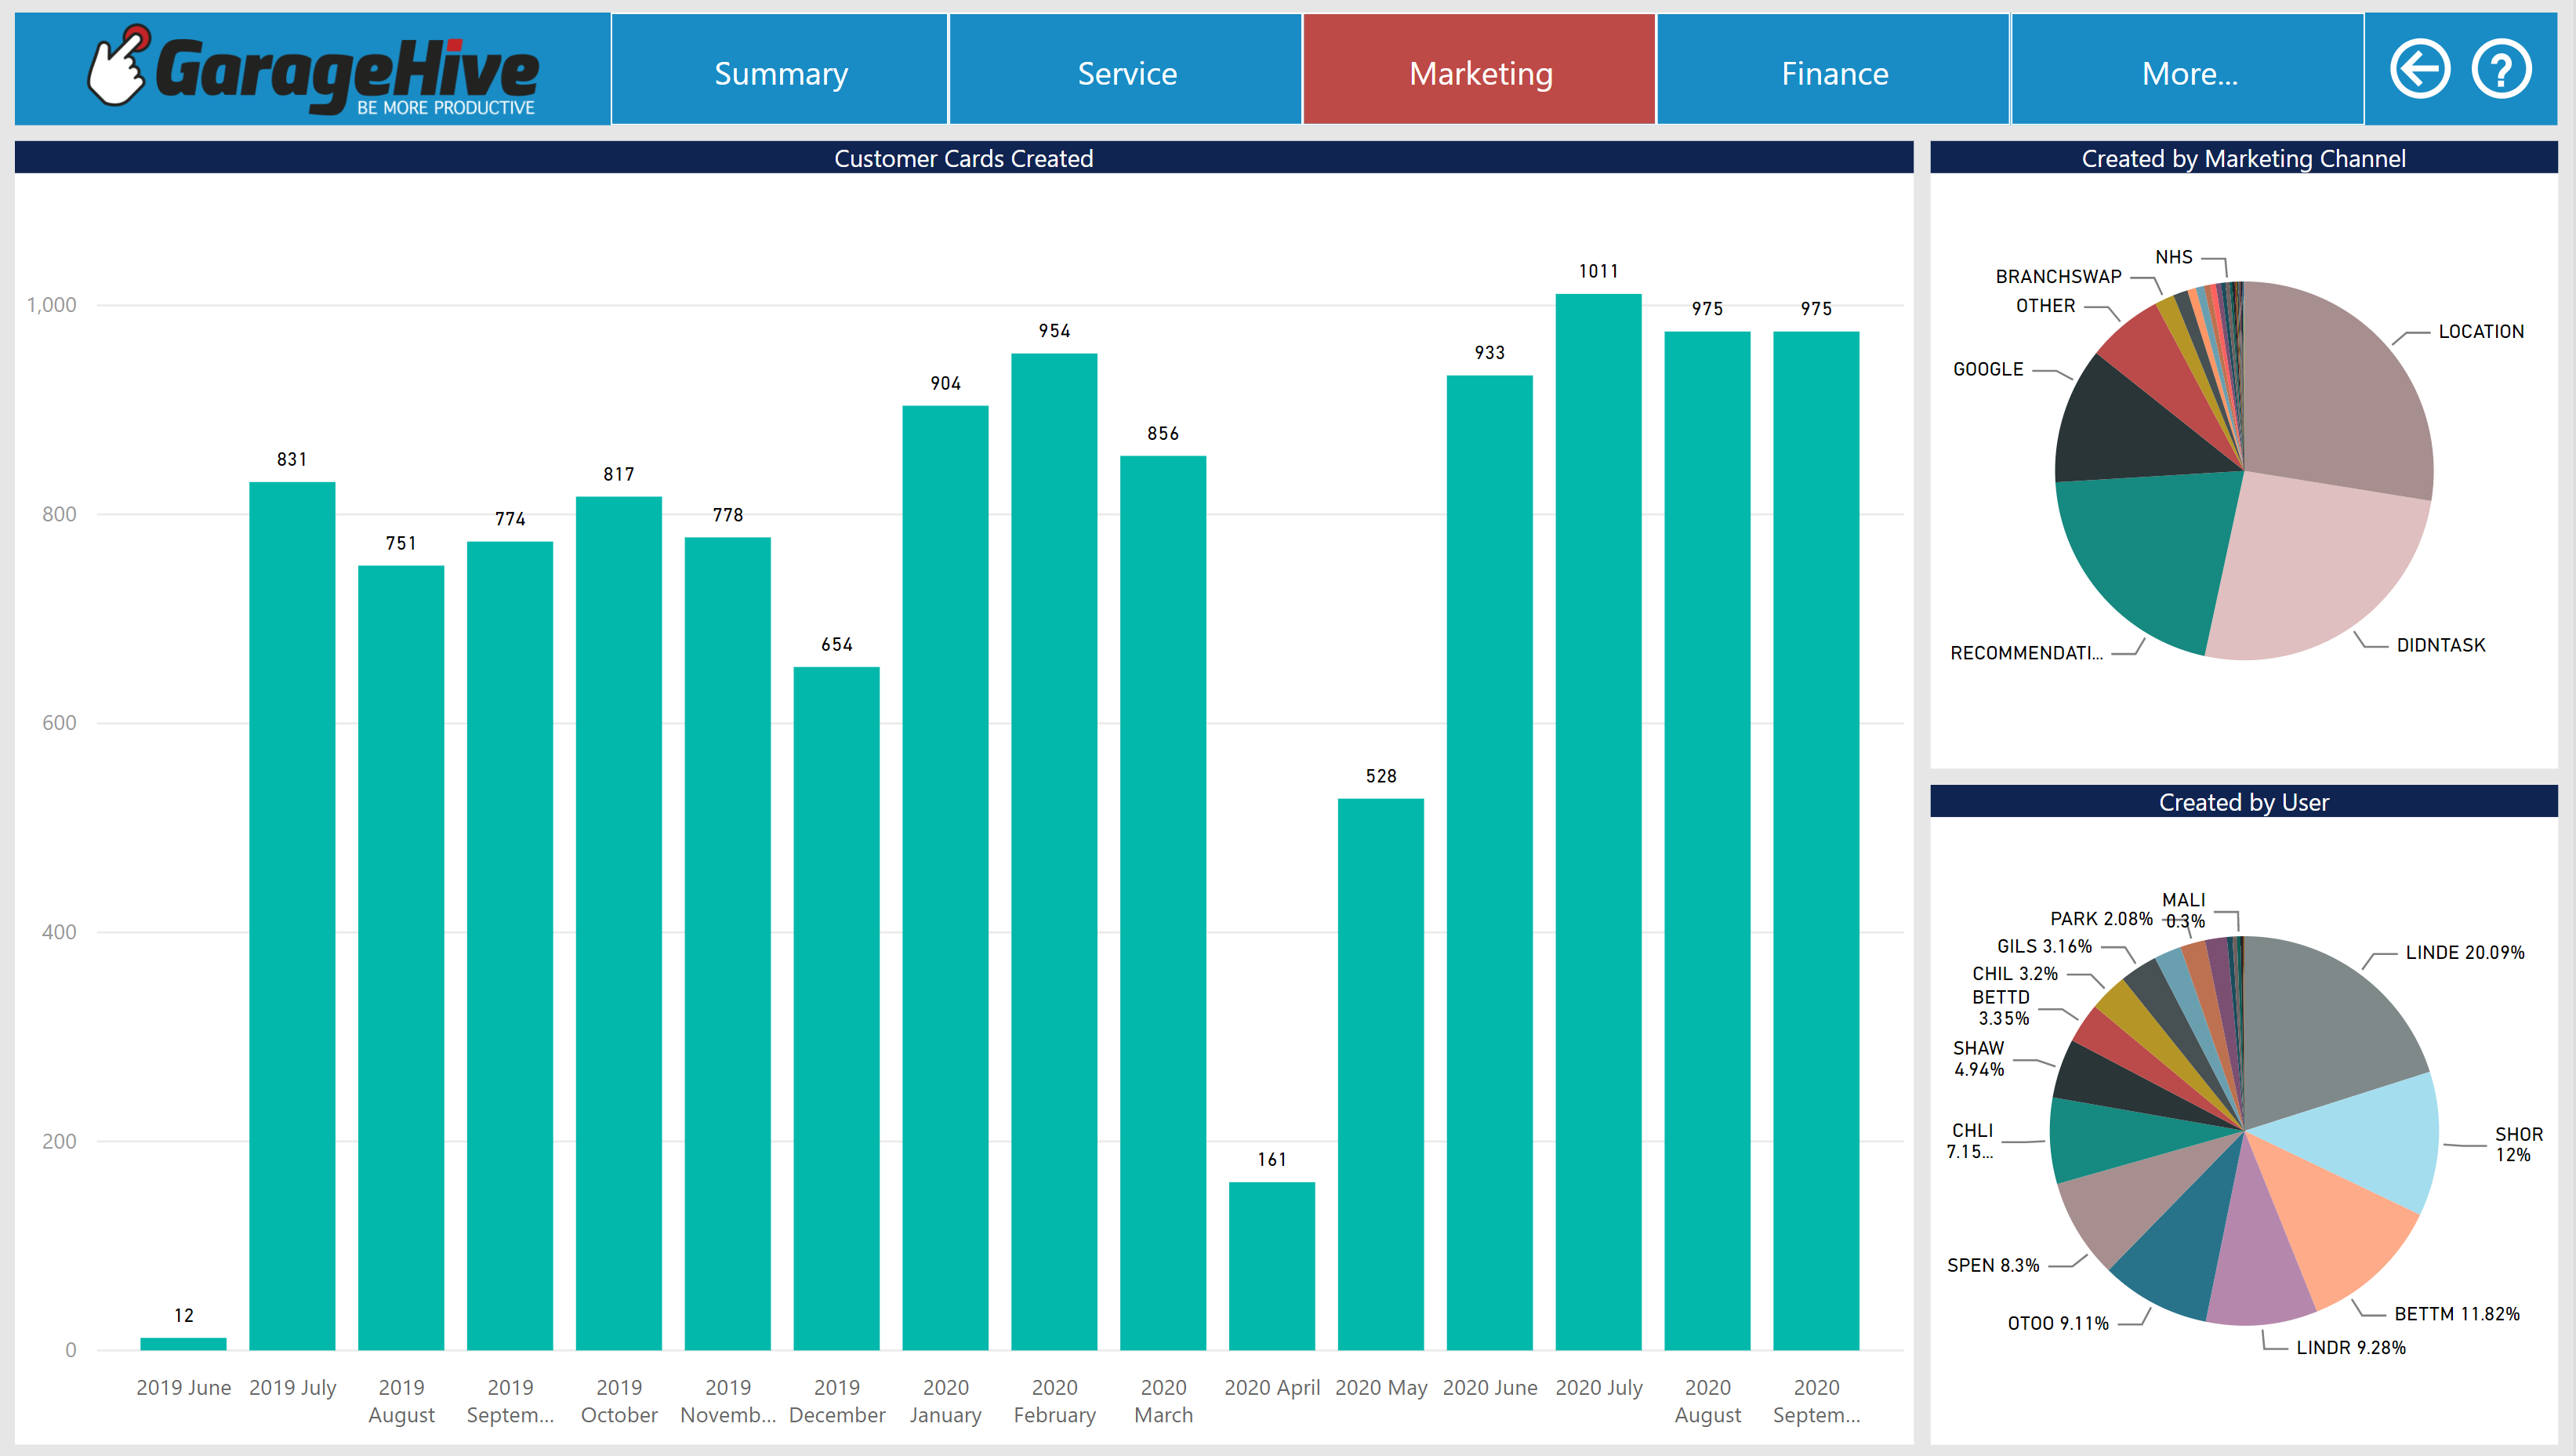
- Customer Cards Created – This report allows you to see how many customer cards were created during a certain period. This report gives insight into whether you are getting enquiries from new customers.
- Customer Notification Analysis – This report allows you to analyse how many SMS/Emails are being sent to customers and what types of messages are being sent.
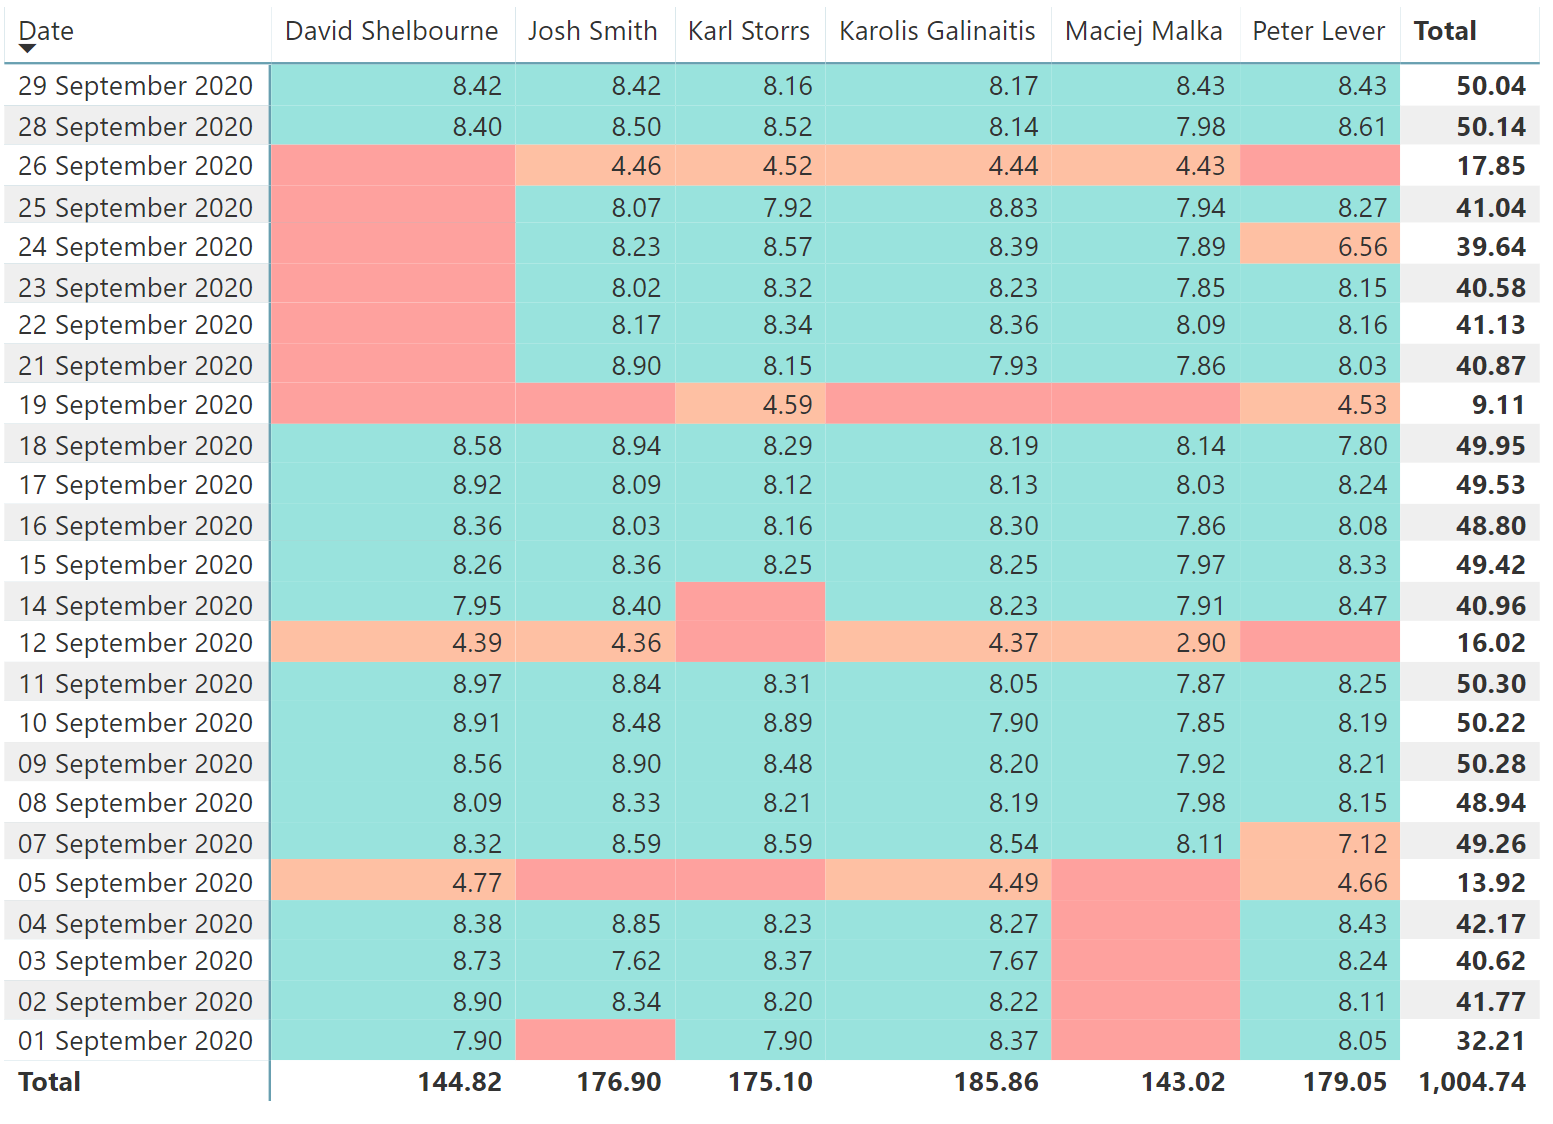
- Attendance – This report allows you to easily see the attendance of staff over a given time period.
Introduced 3 new vehicle sales reports.
- Vehicle Sales – This report allows you to see the margin and profit per vehicle sold, as well as the types of vehicles being sold.
- Vehicle Sales Weekly Analysis – This report allows you to monitor the key KPIs of your vehicle sales department on a week by week basis.
- Vehicle Sales Monthly Analysis – This report allows you to monitor the key KPIs of your vehicle sales department on a month by month basis.
Changes to existing reports and pages.
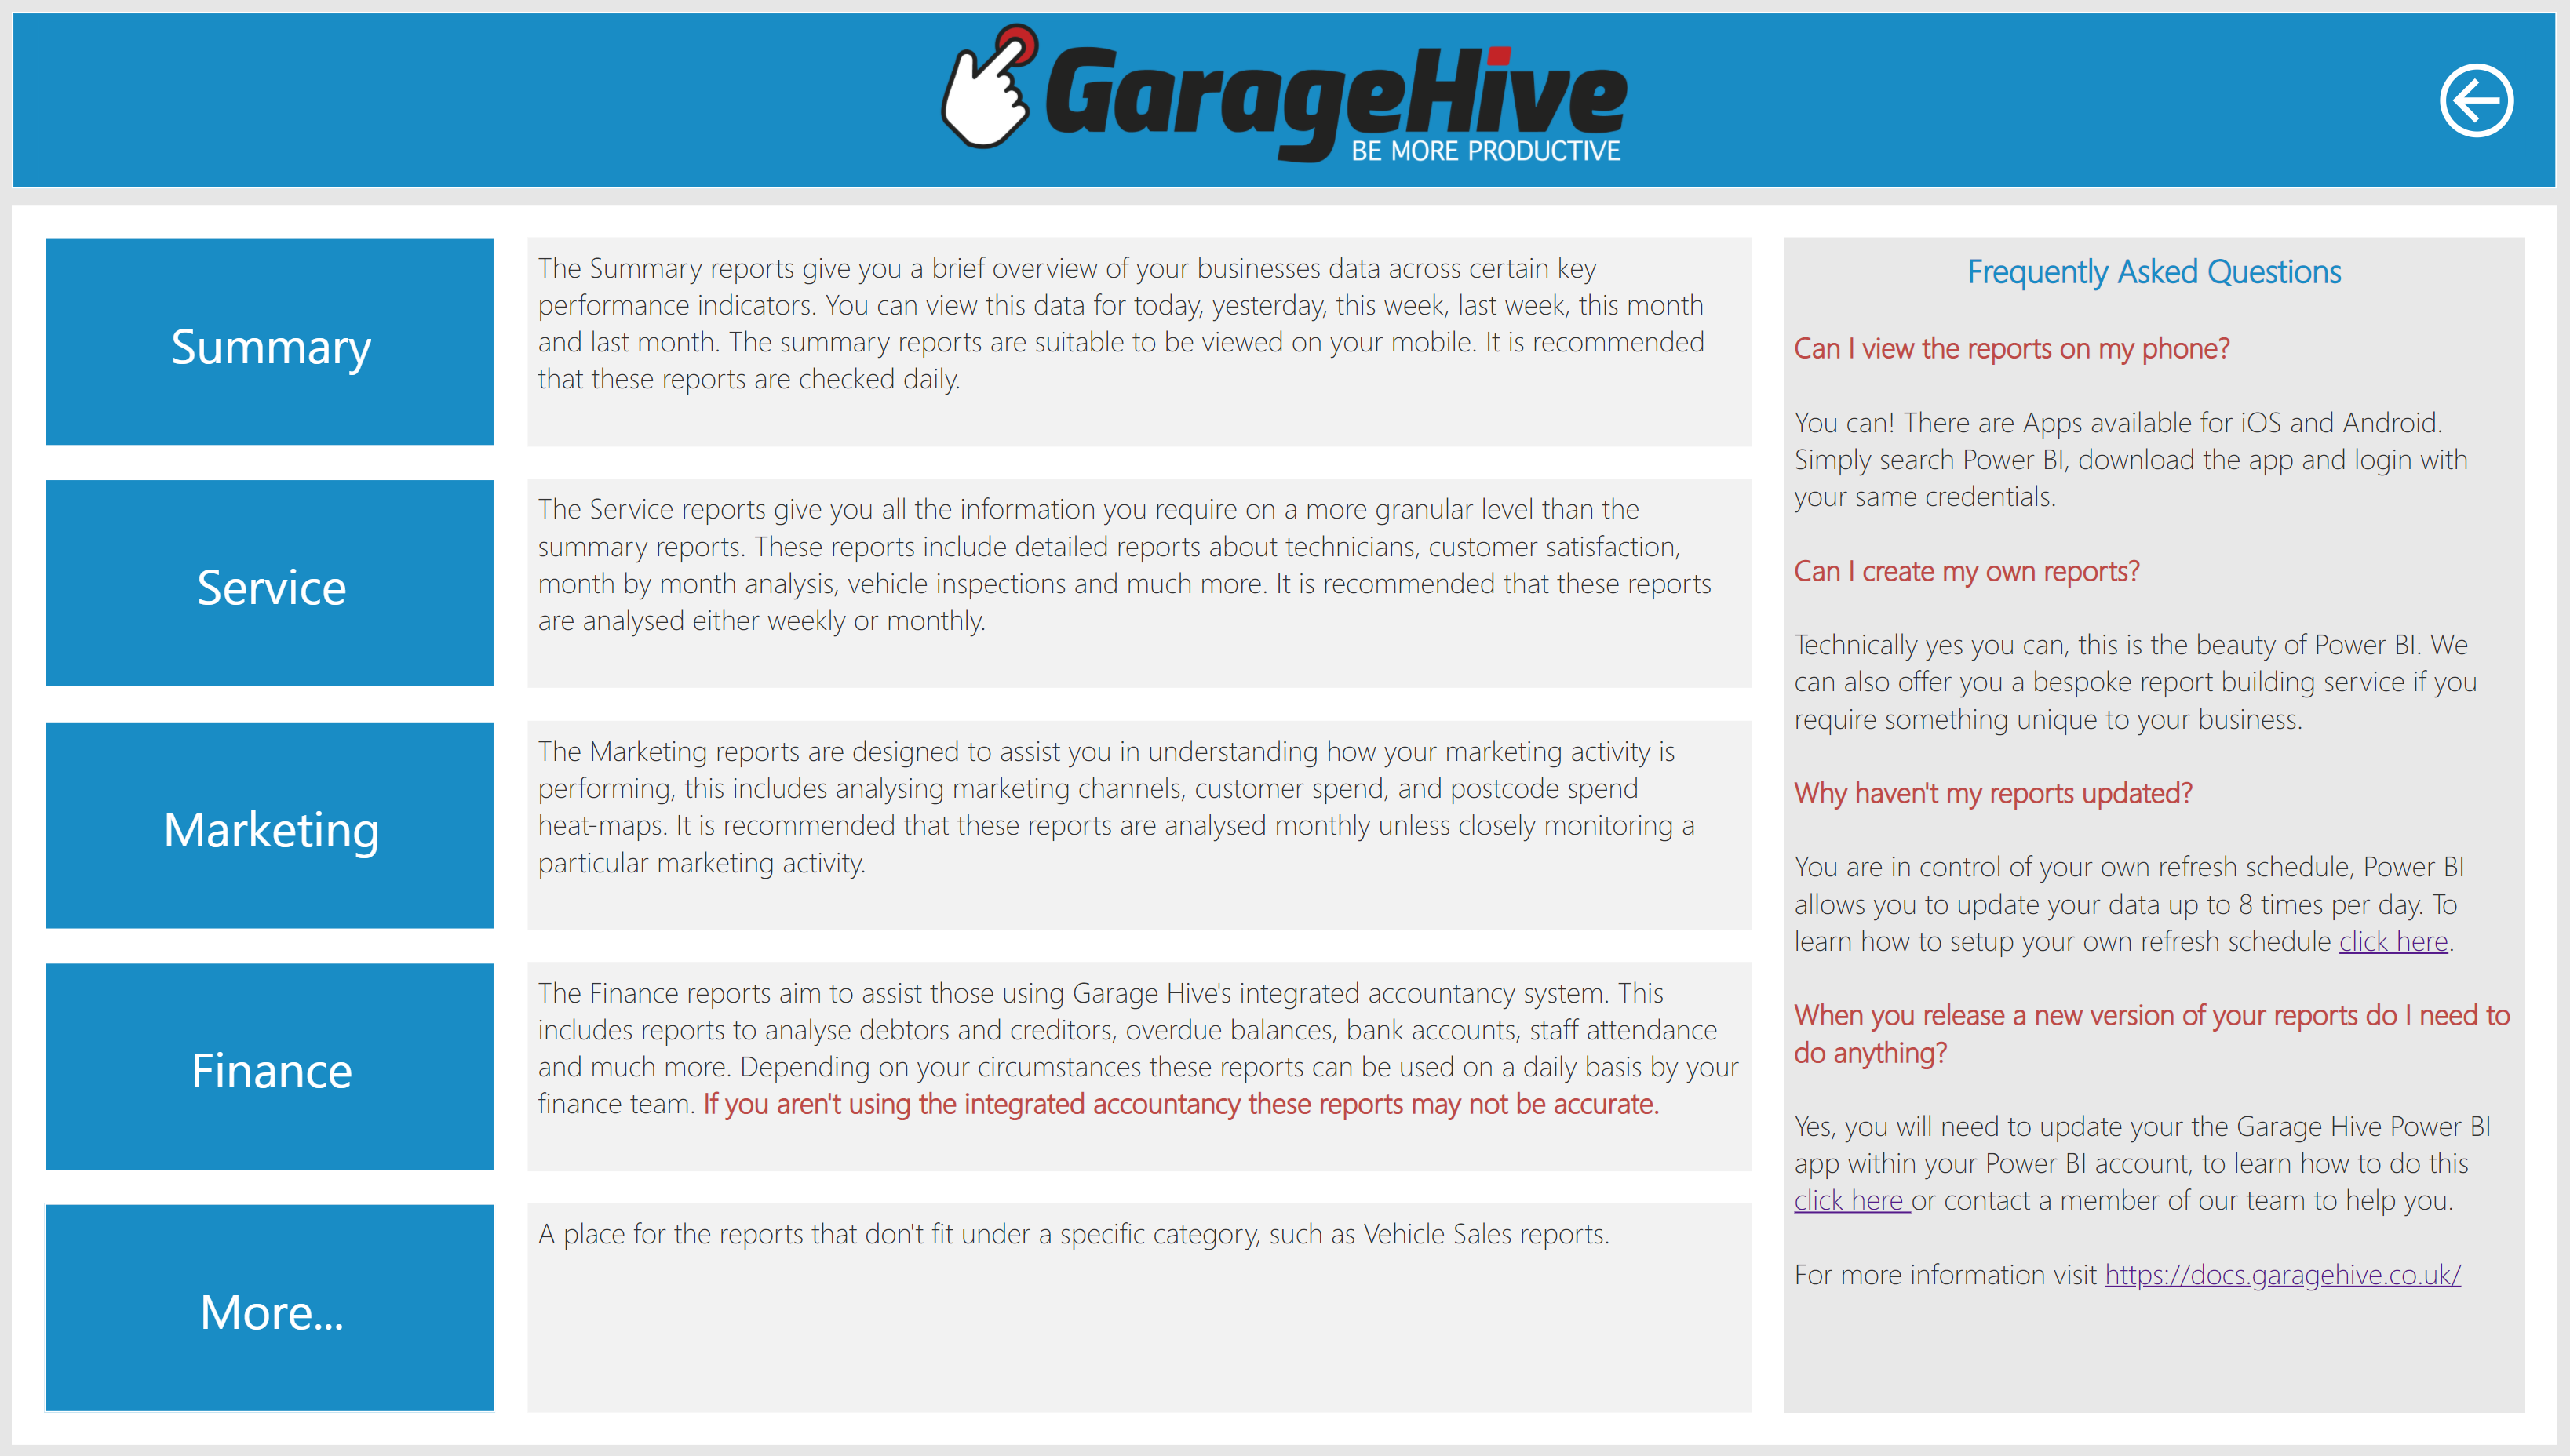
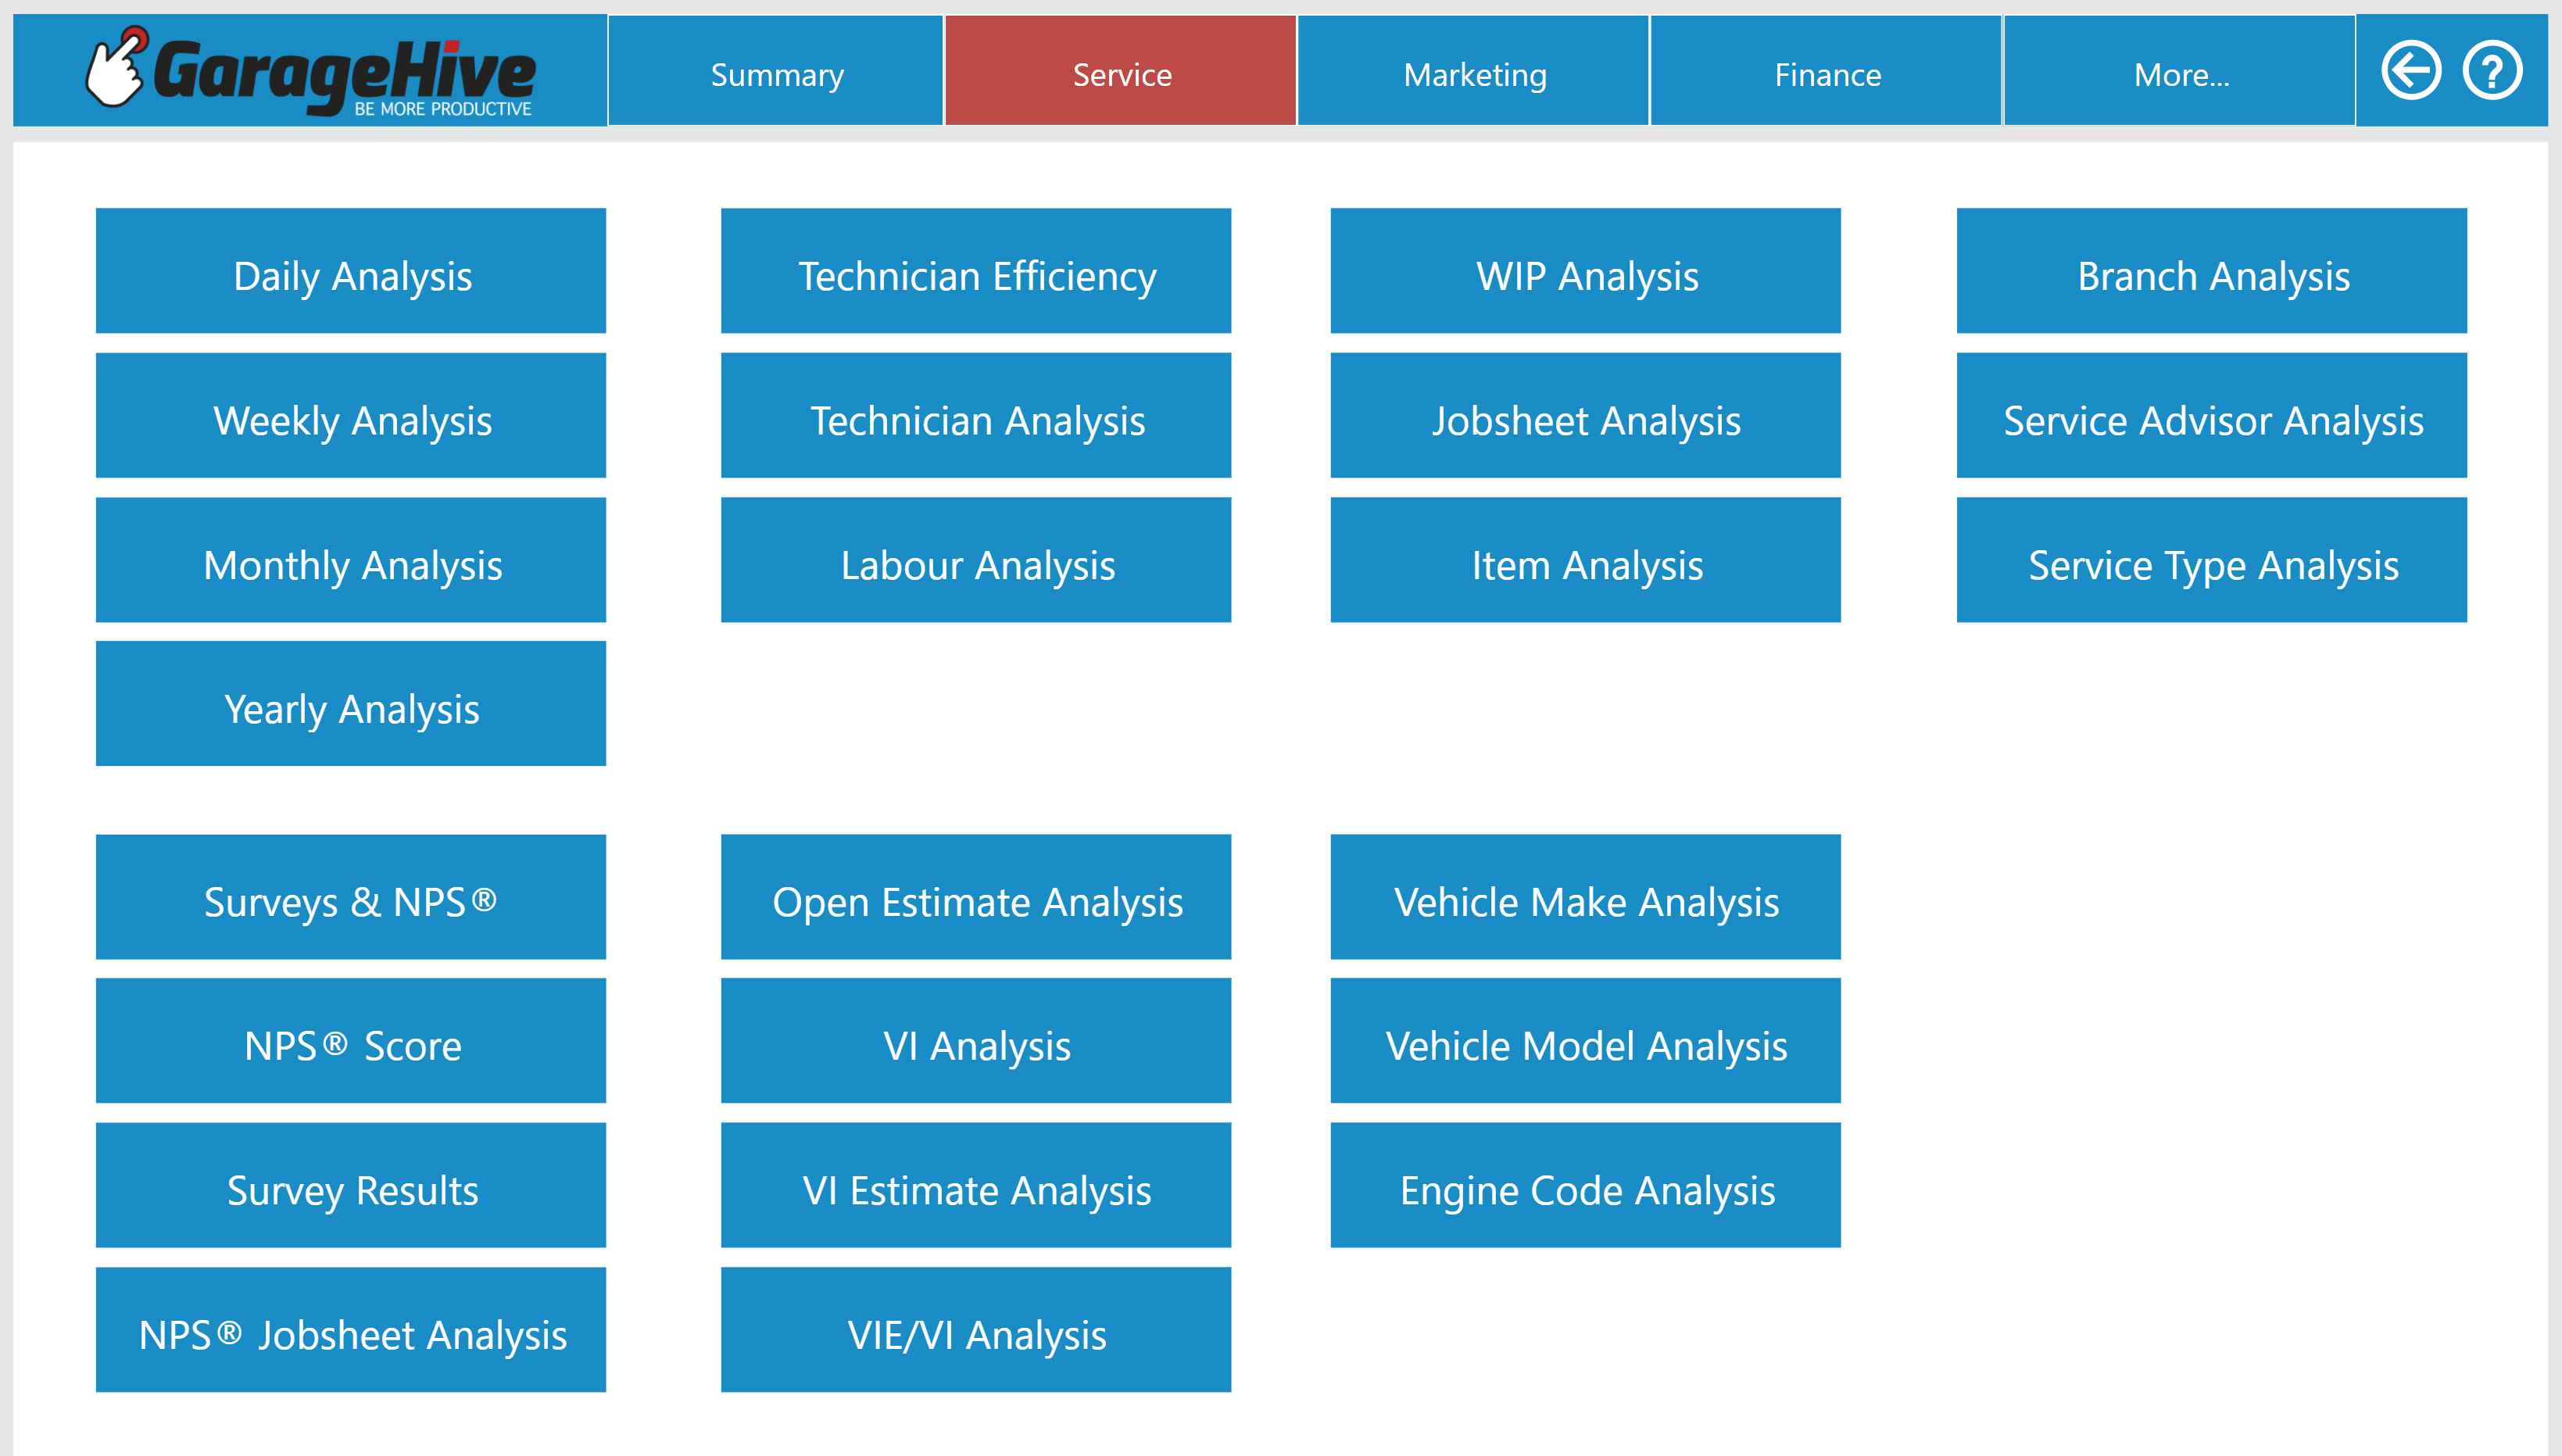
- Introduced an Index, new menu and ways to navigate the app.
- New Summary reports, introducing separate pages for Today, Yesterday, This Week, Last Week, This Month, and Last Month.
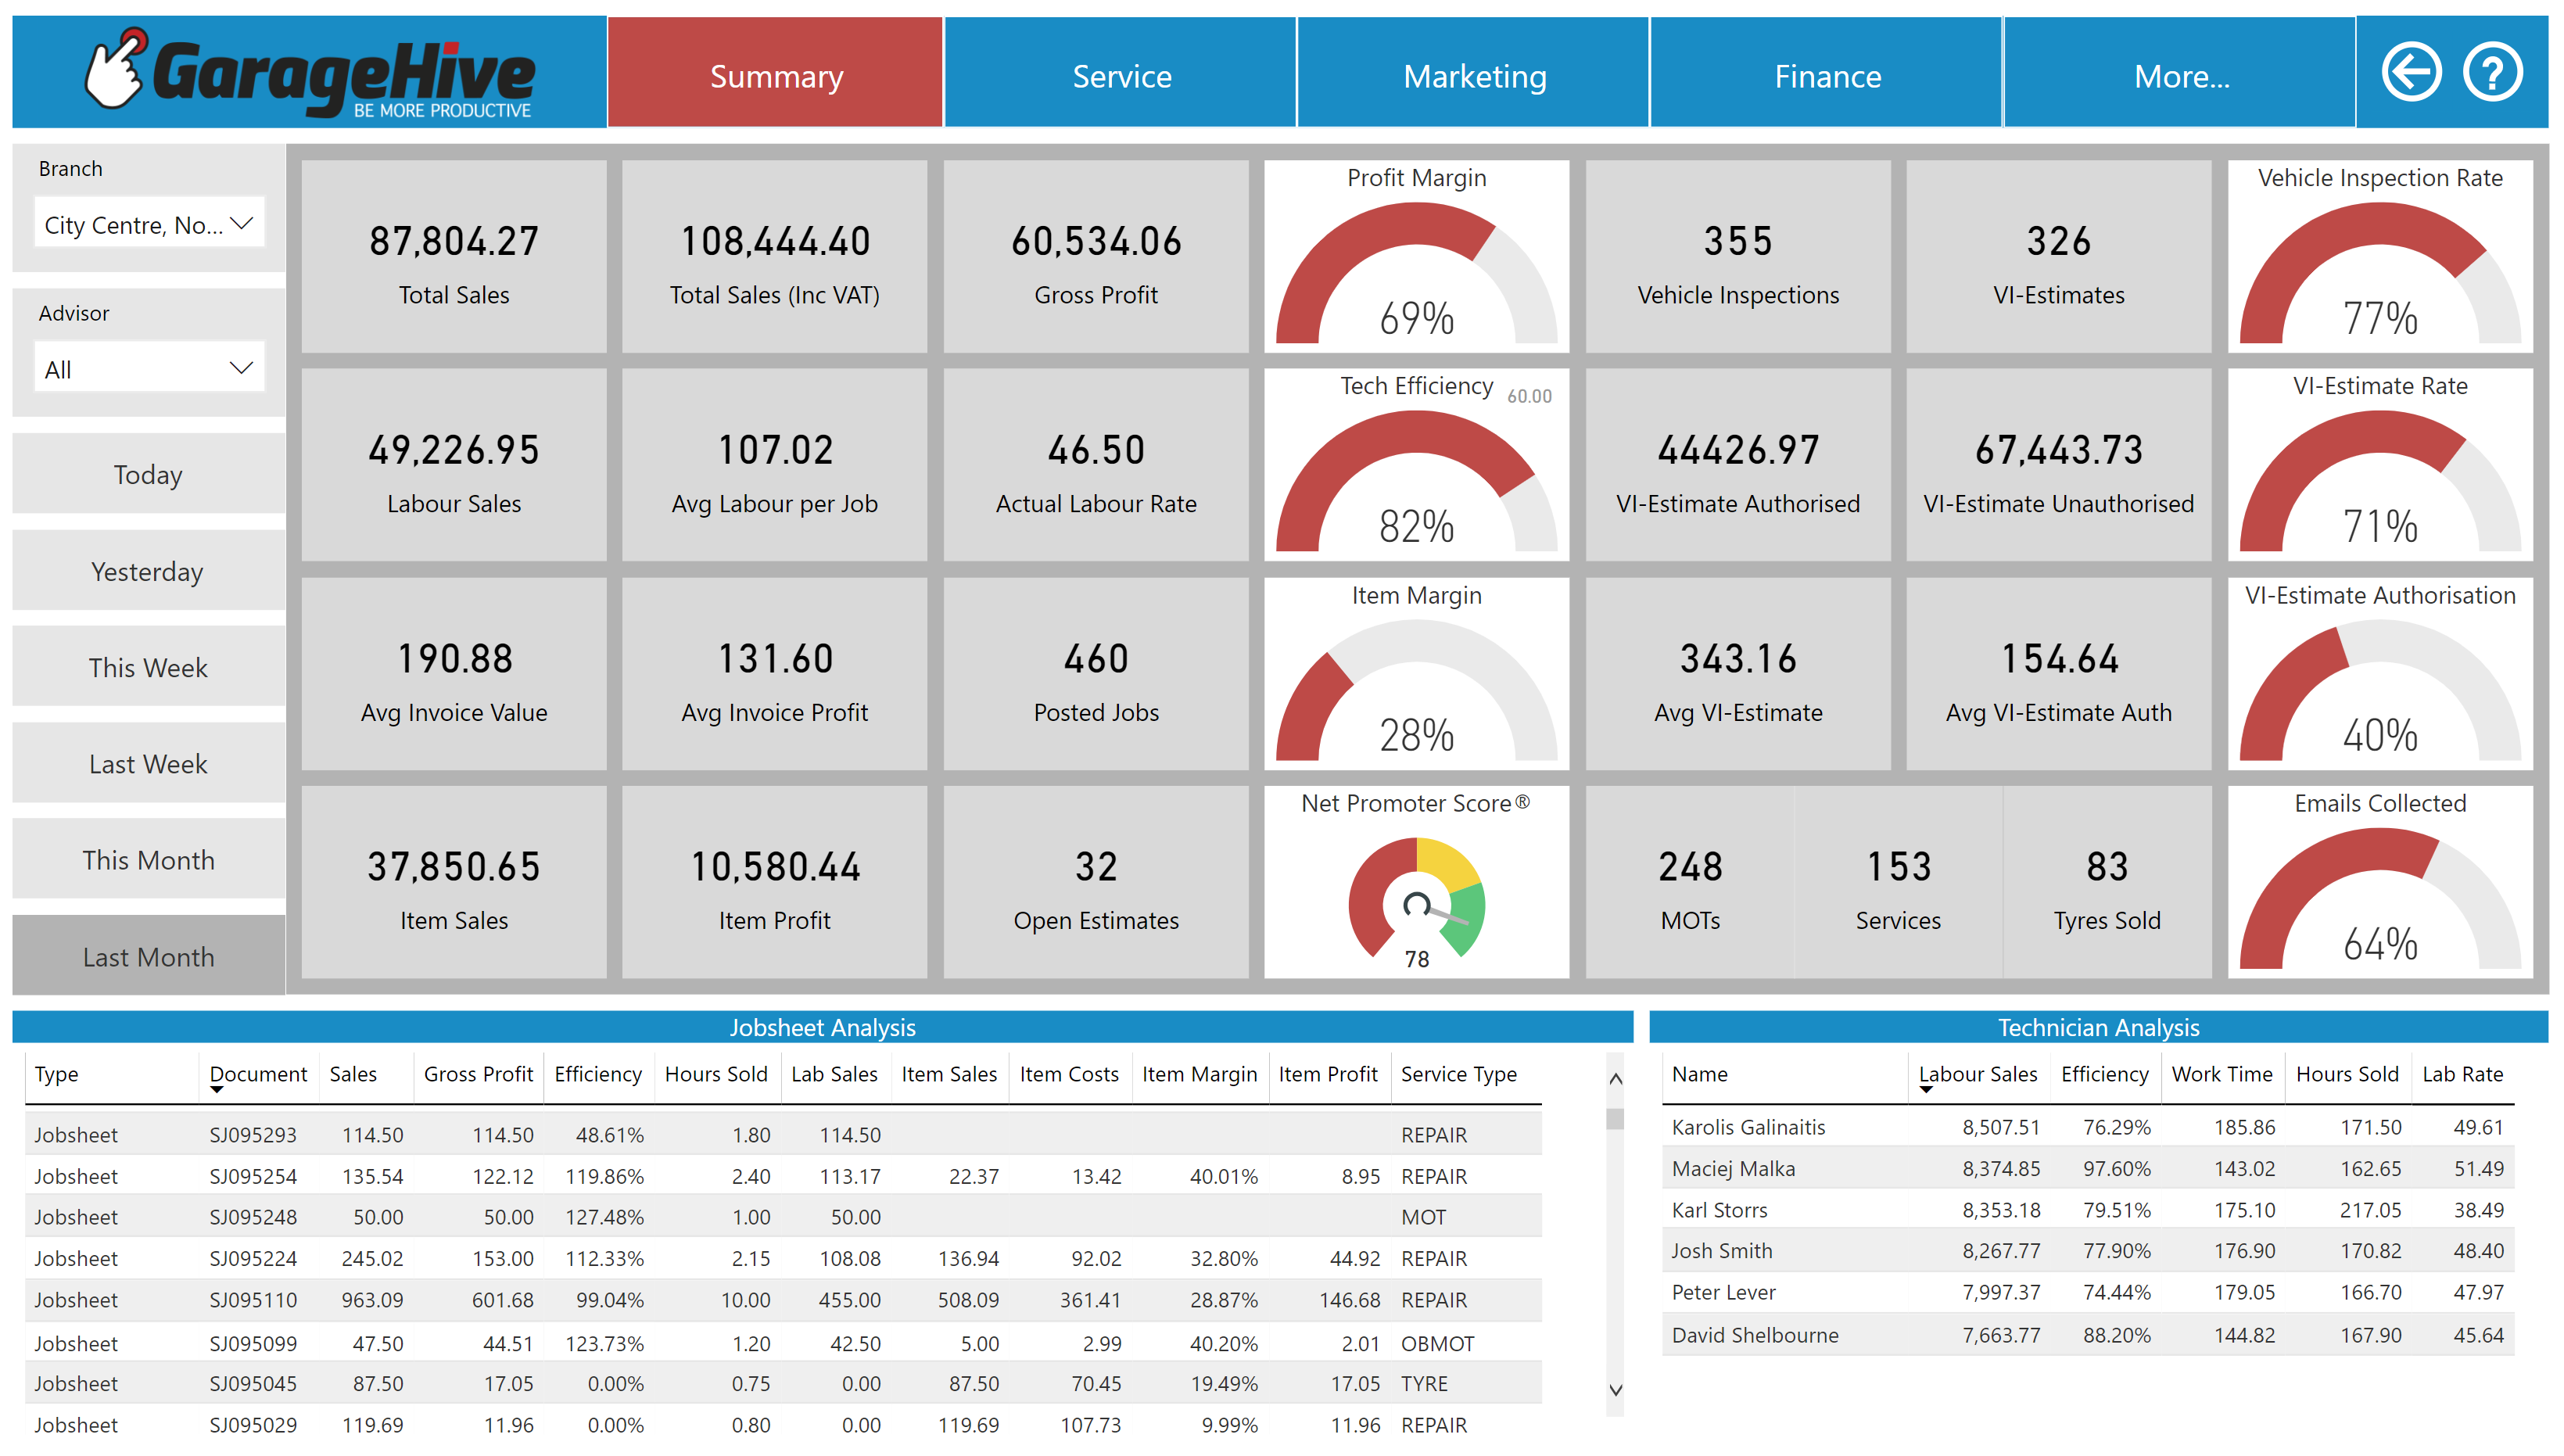
- New mobile layouts for the summary pages, including a new menu.
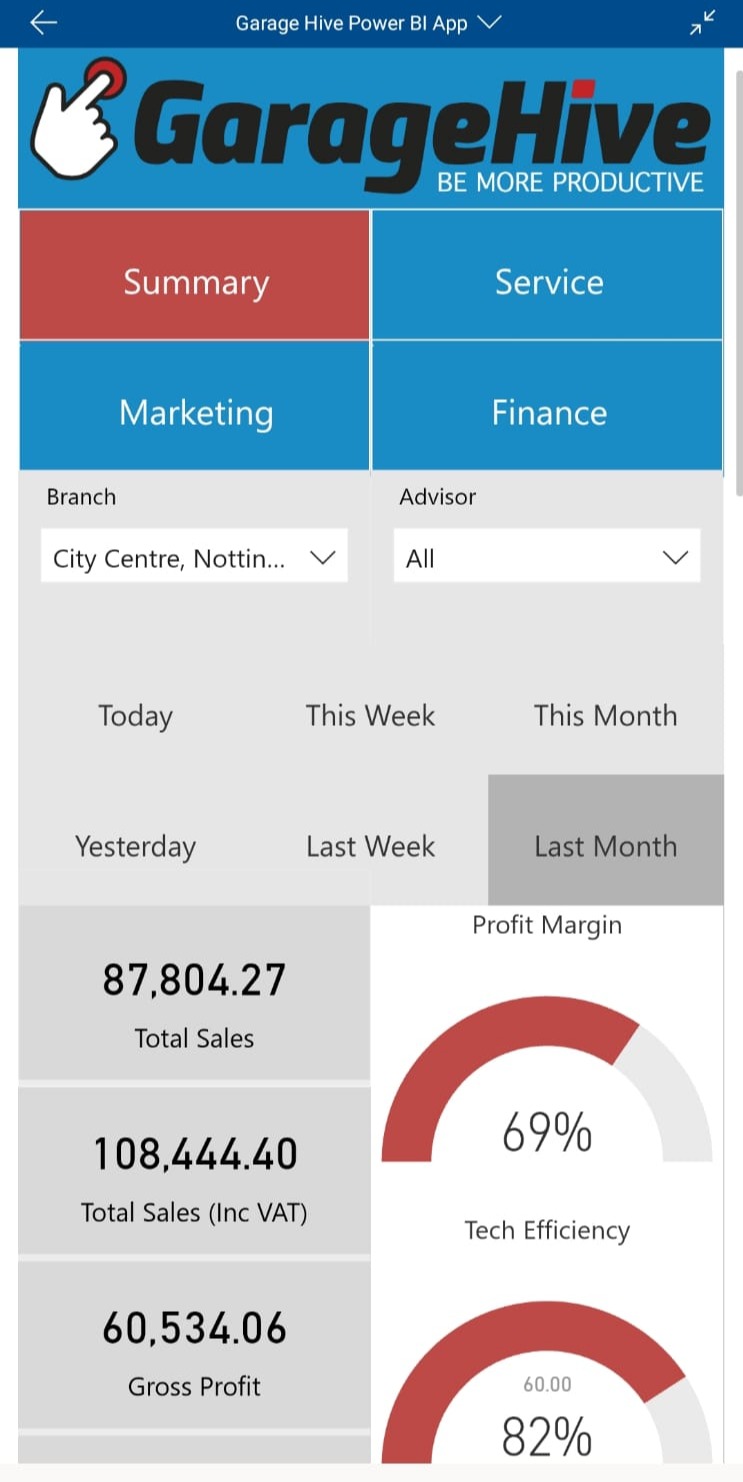
- Additional information is now available on the summary reports, as well as some technician performance information and individual jobsheet analysis. You can now also view revenue including VAT.
- Summary reports can also now be filtered by service advisors.
- Added the ability to view nearly all KPIs on the daily, weekly, monthly and yearly analysis reports. There are now a total of 39 columns of data to analyse.
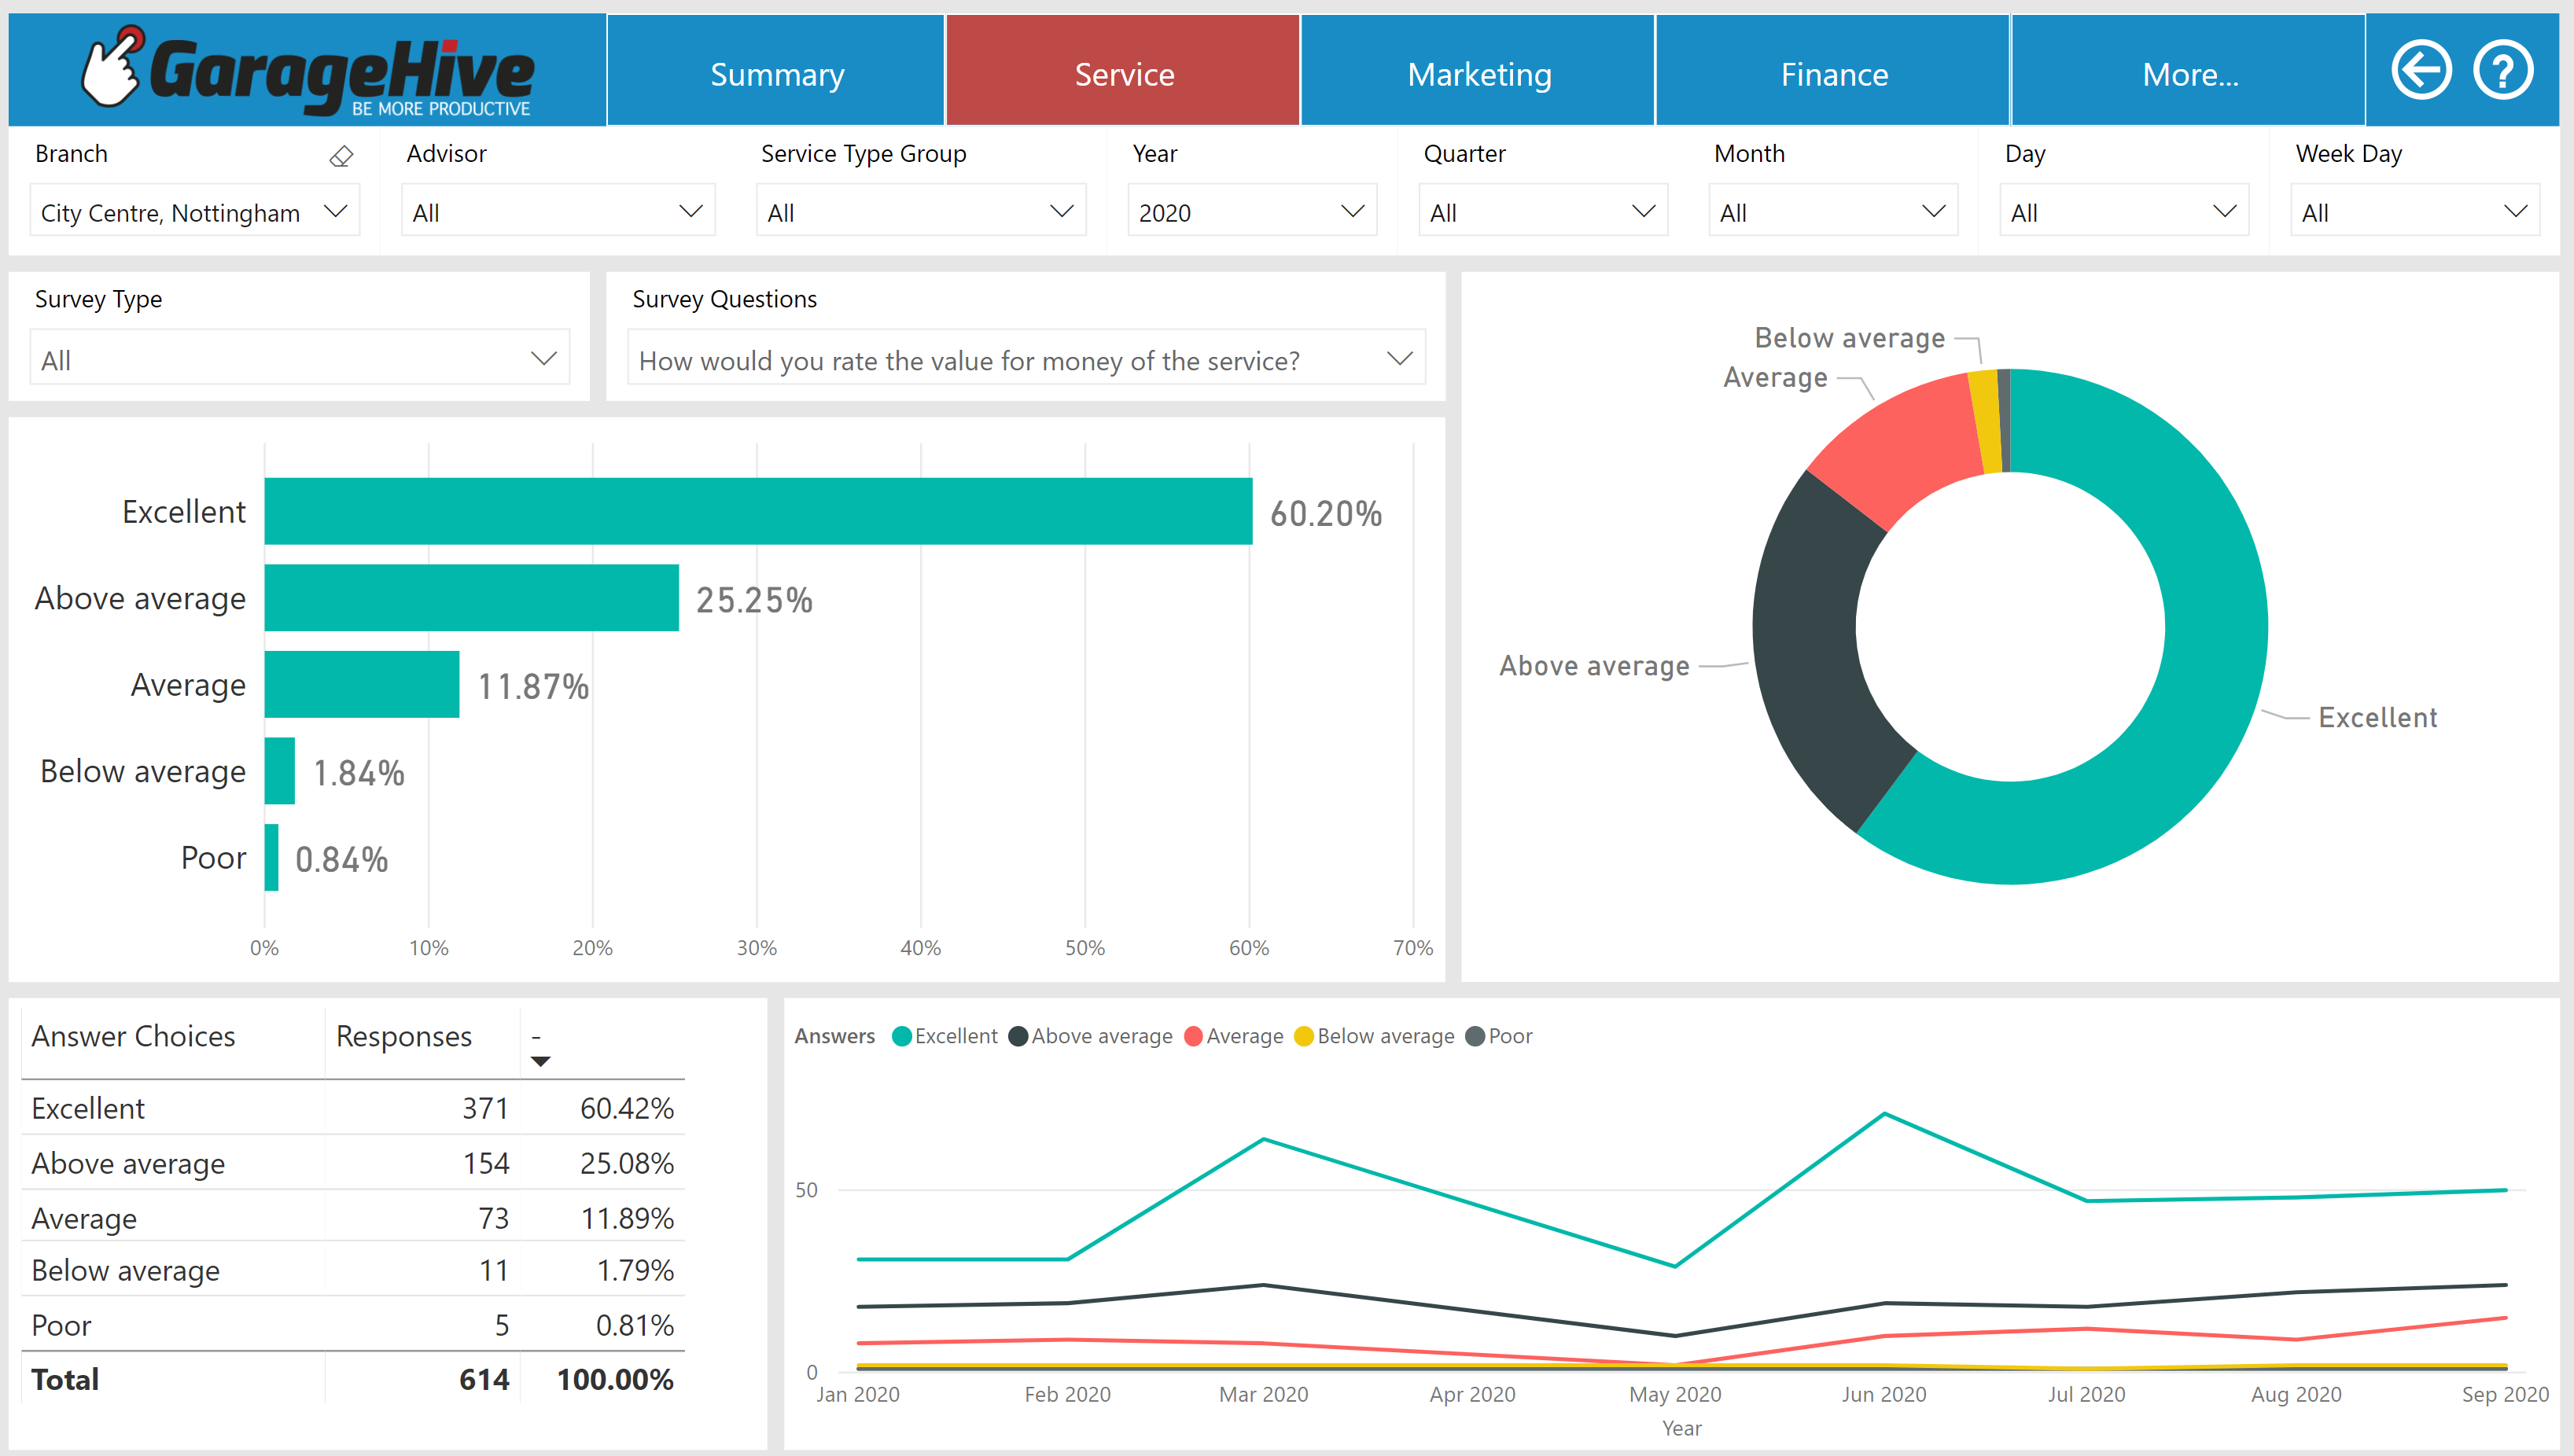
- Added the ability to see survey answers over time, allowing you to understand the trend of some of the customer survey question answers.
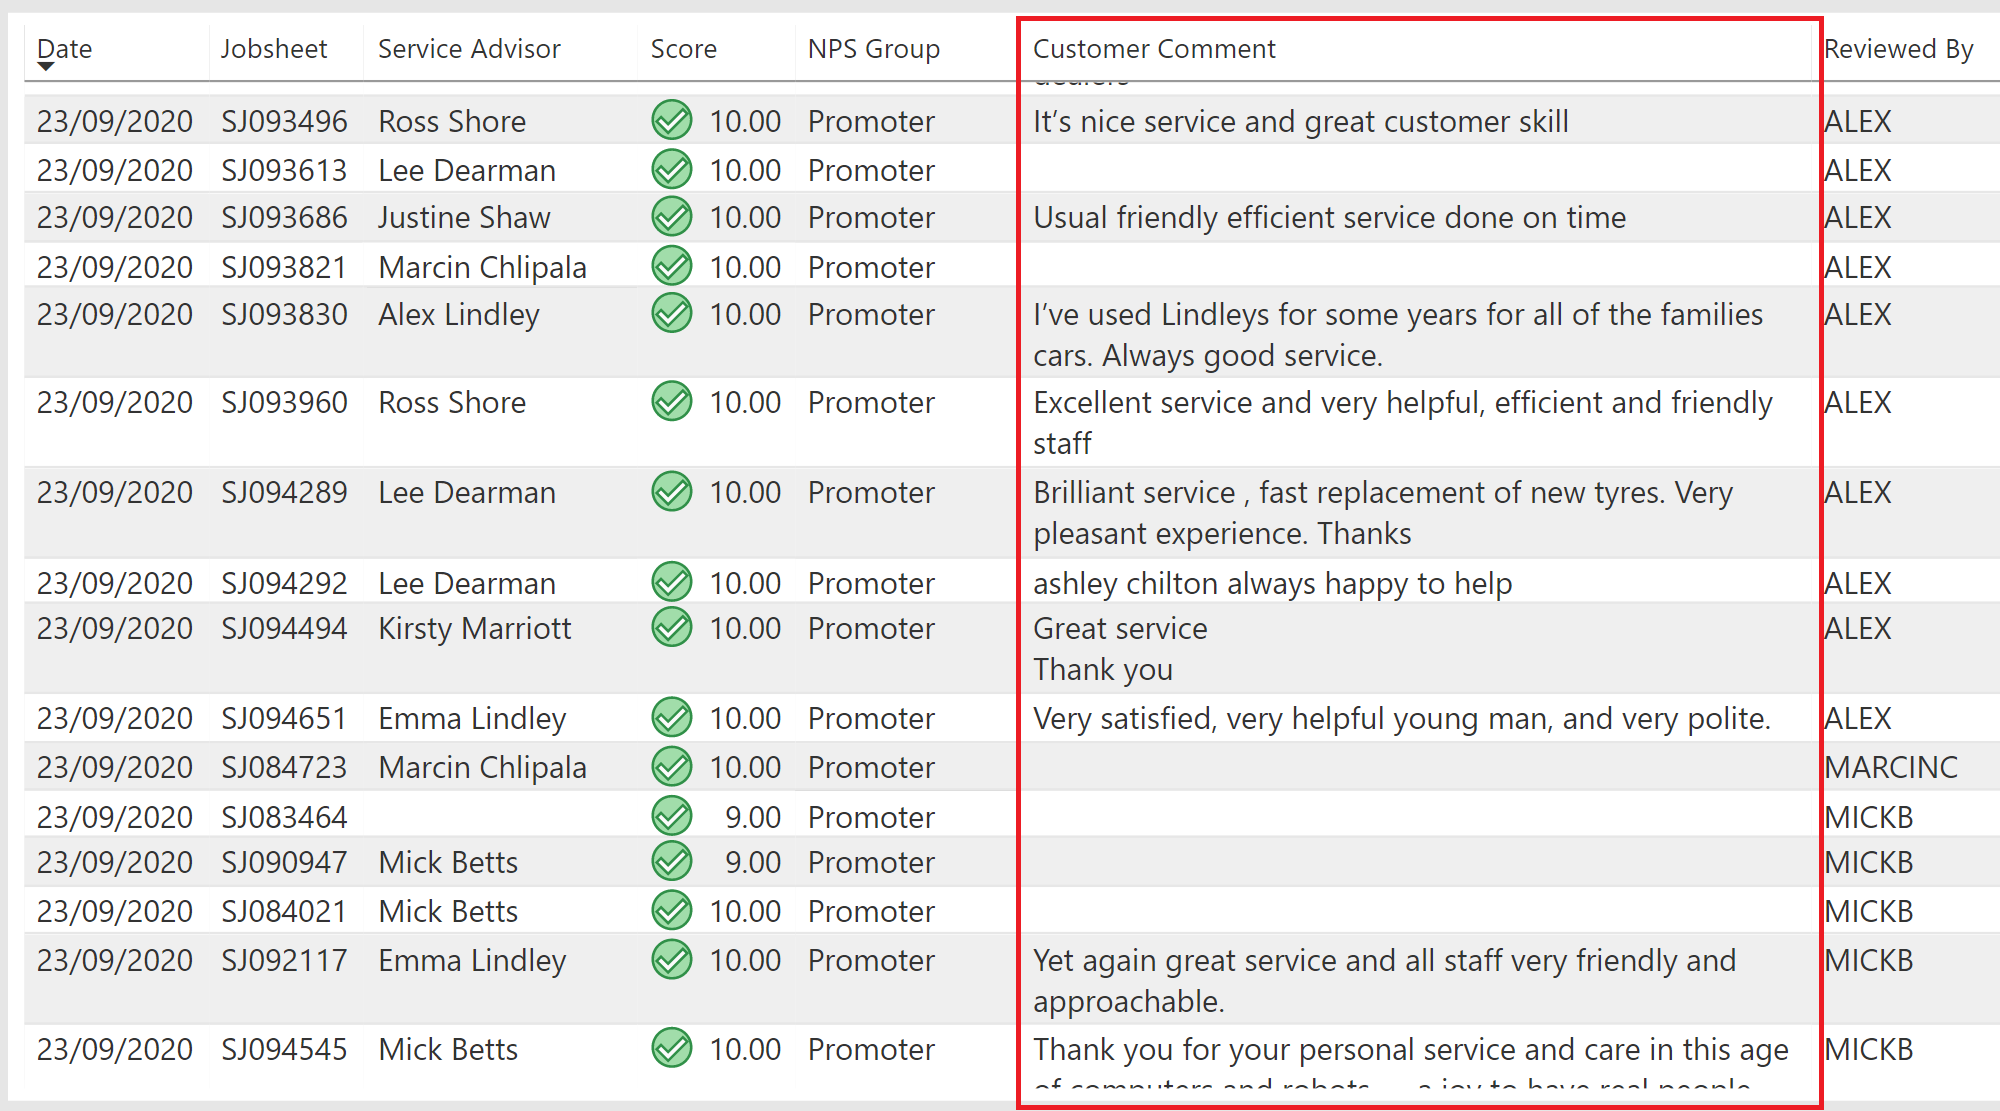
- You can now view customer NPS comments easily on the NPS Jobsheet Analysis report.
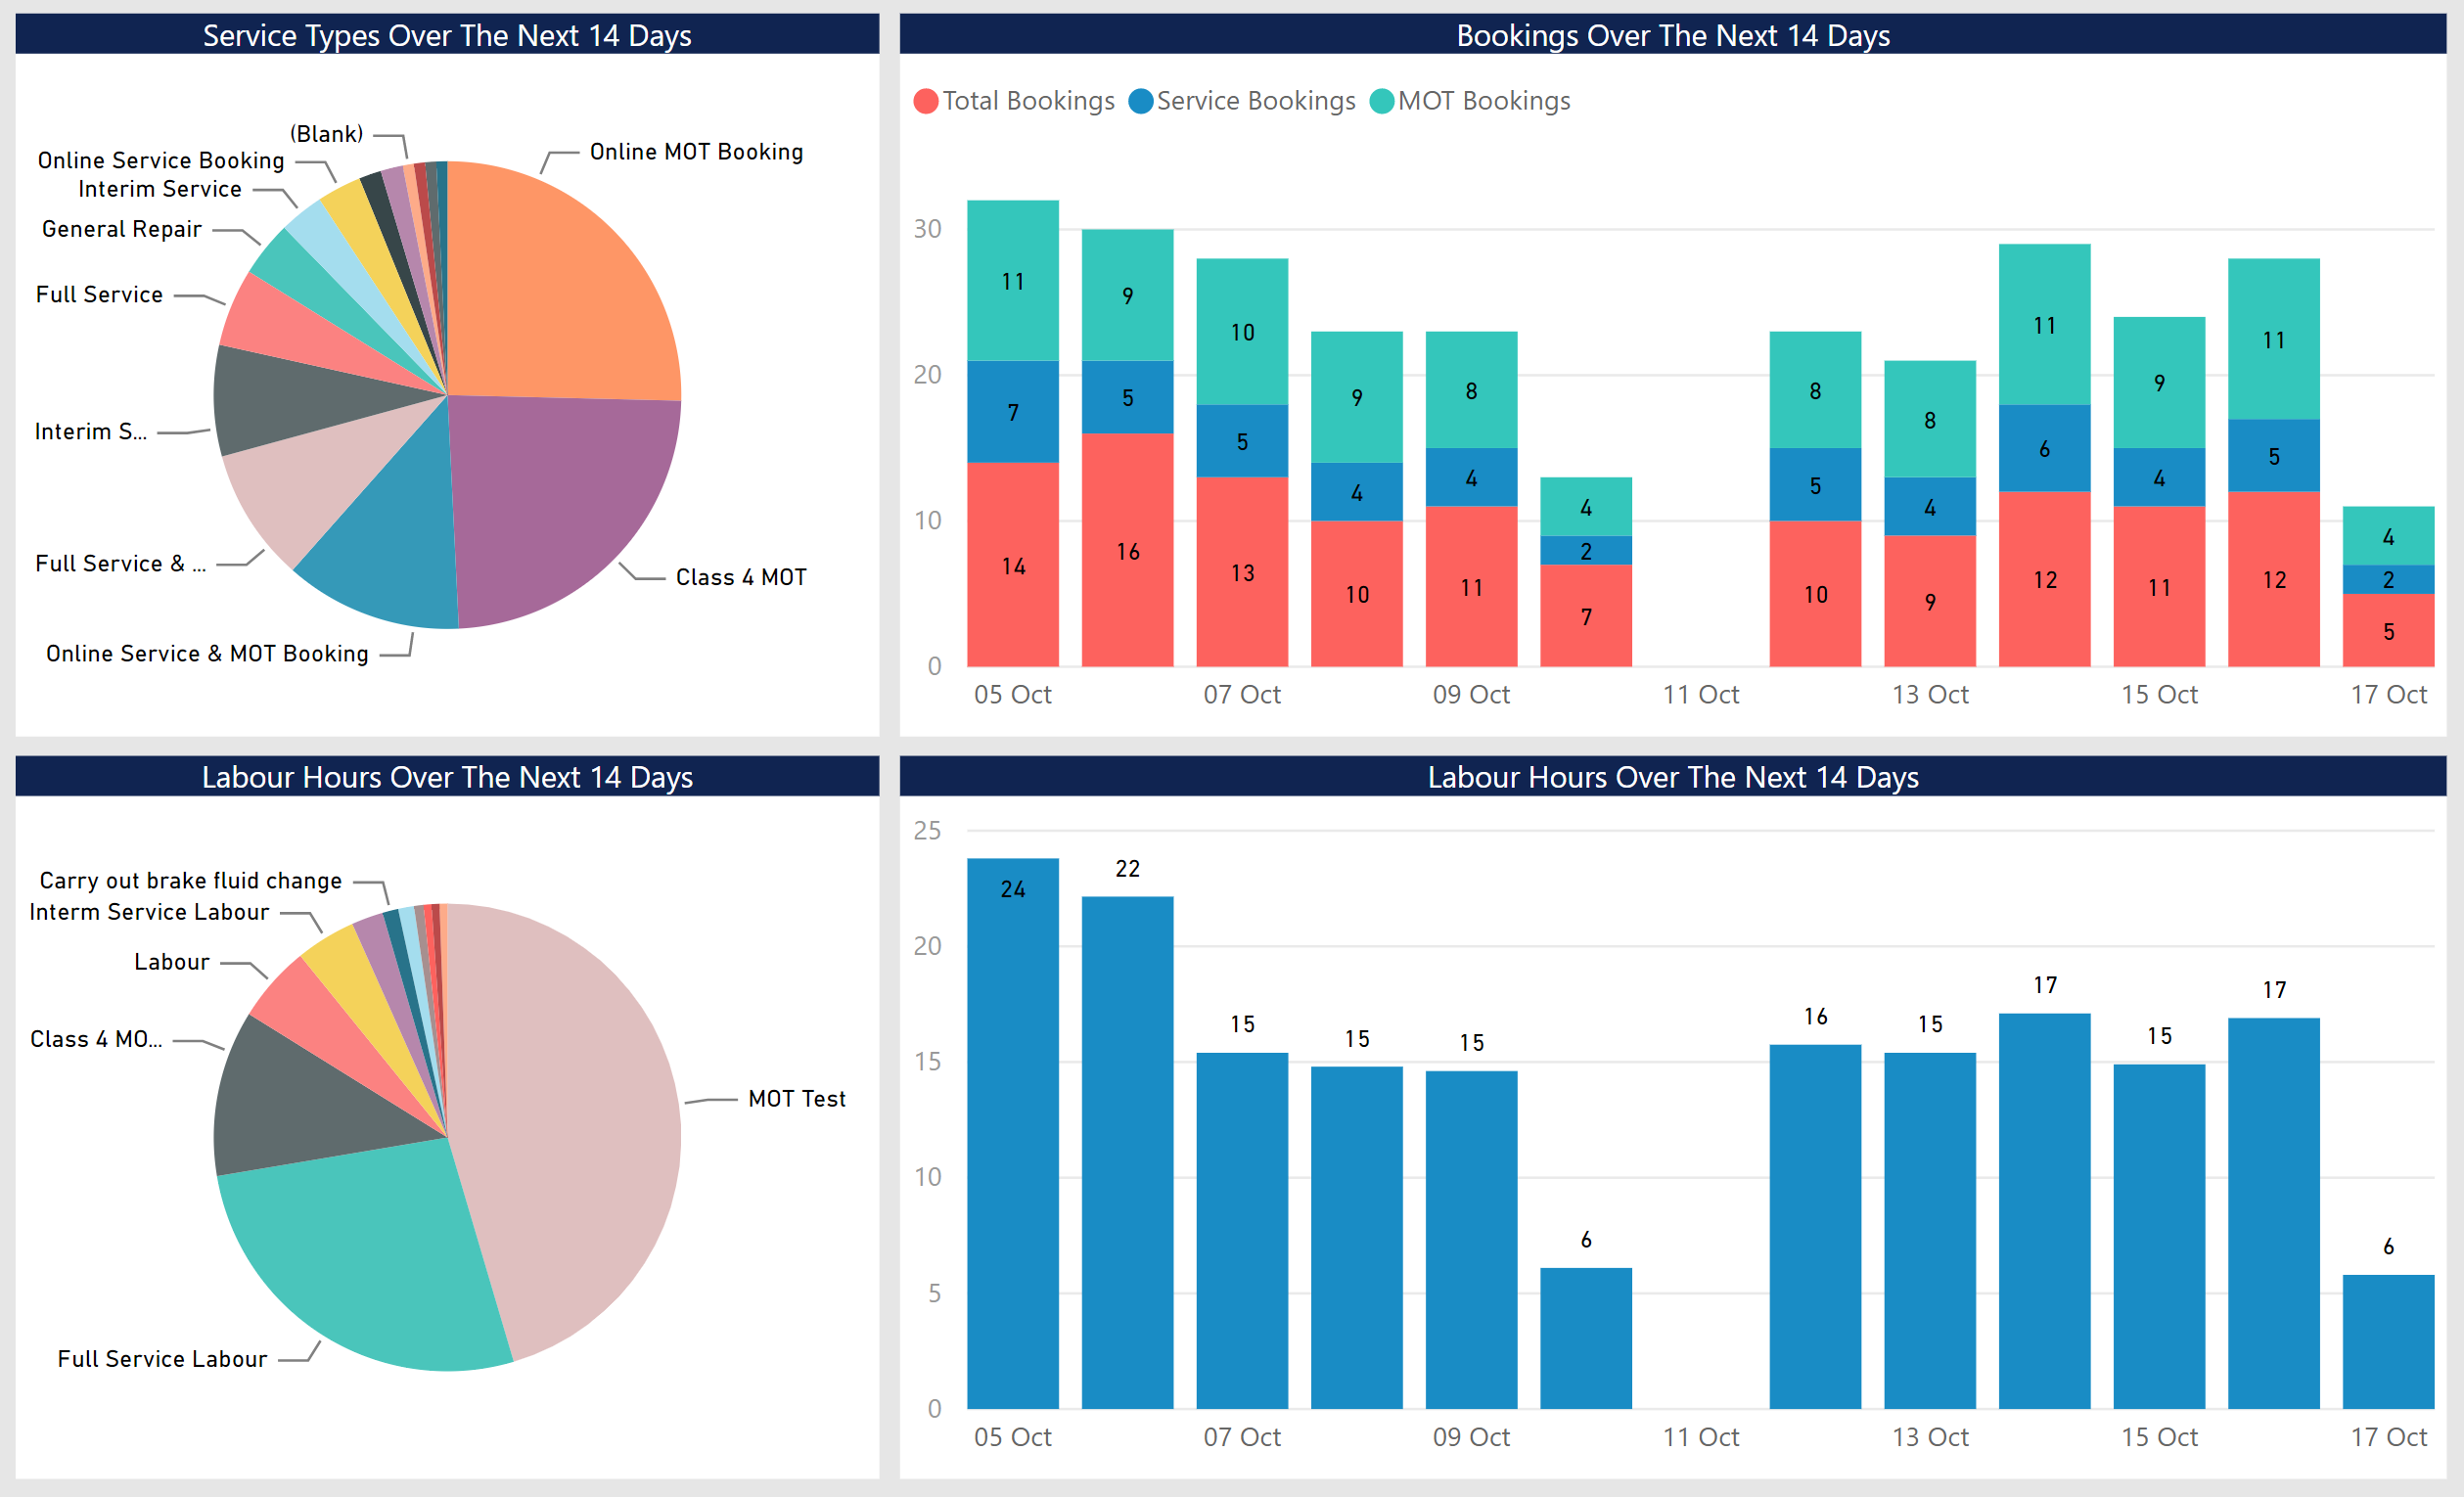
- Added labour hours to future booking reports. In addition to understanding how many bookings you have upcoming, you can now understand how many hours are booked in.
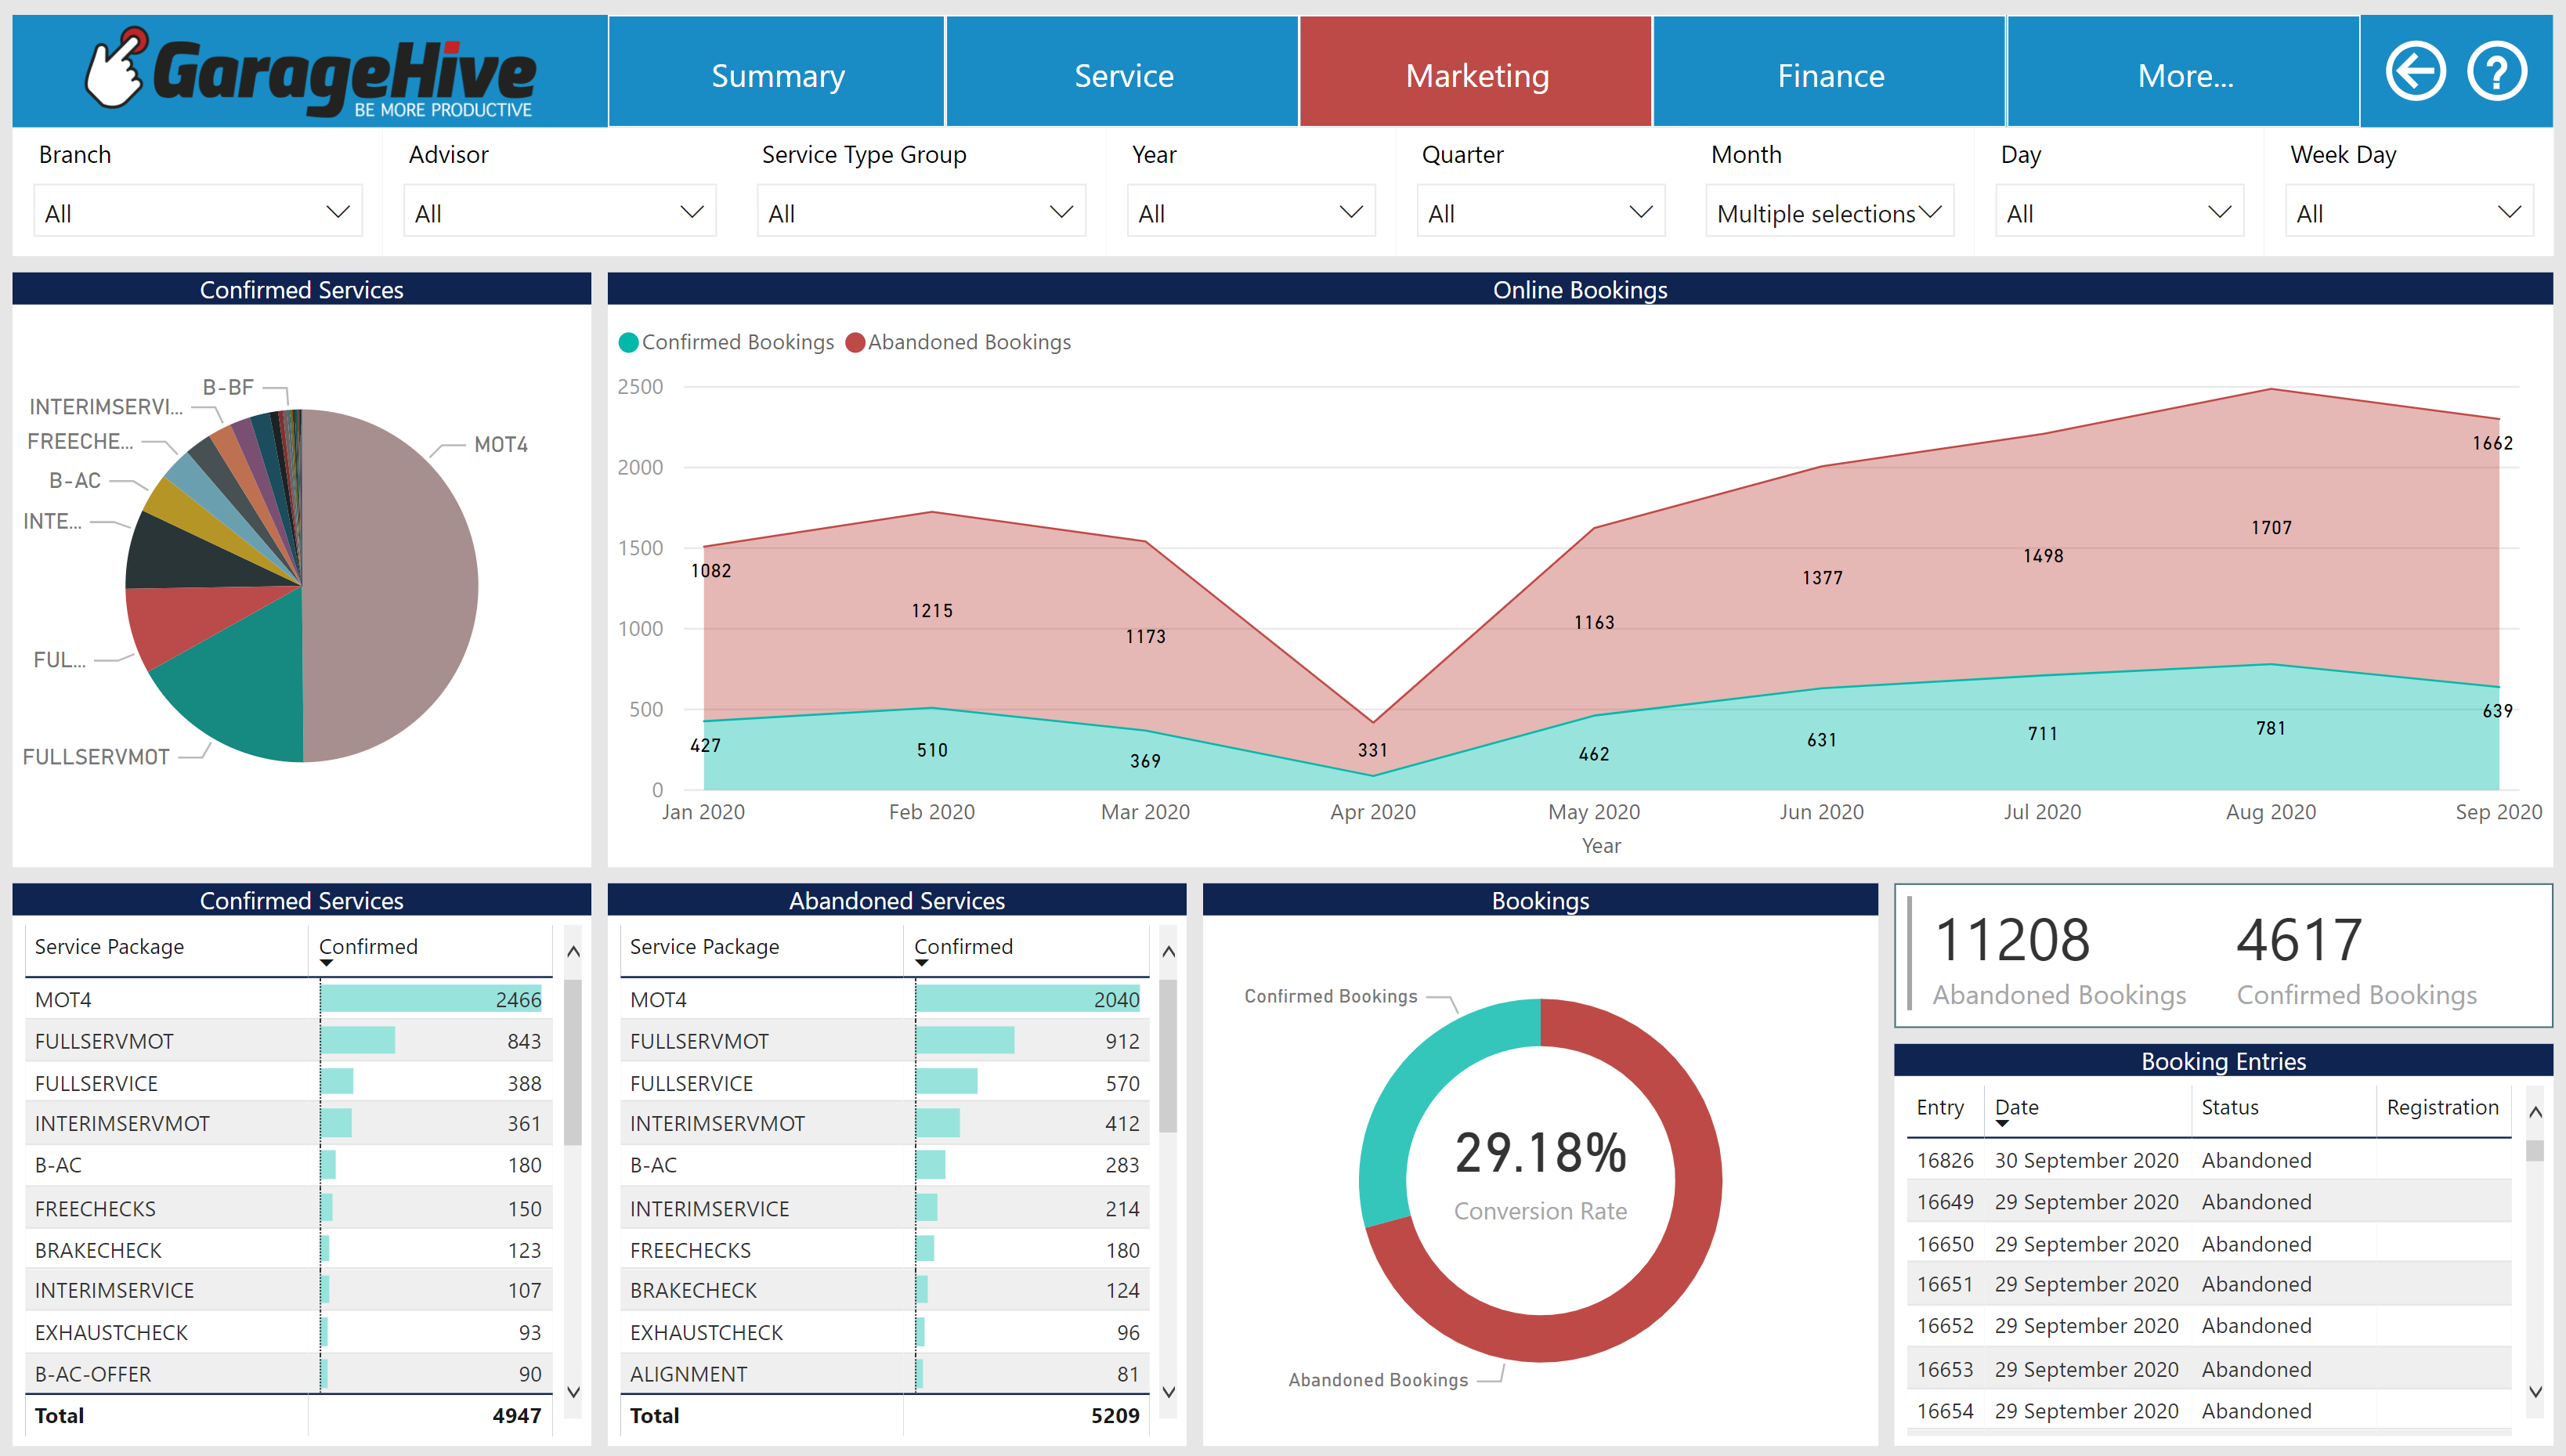
- Online booking analysis now displays data monthly, instead of daily.
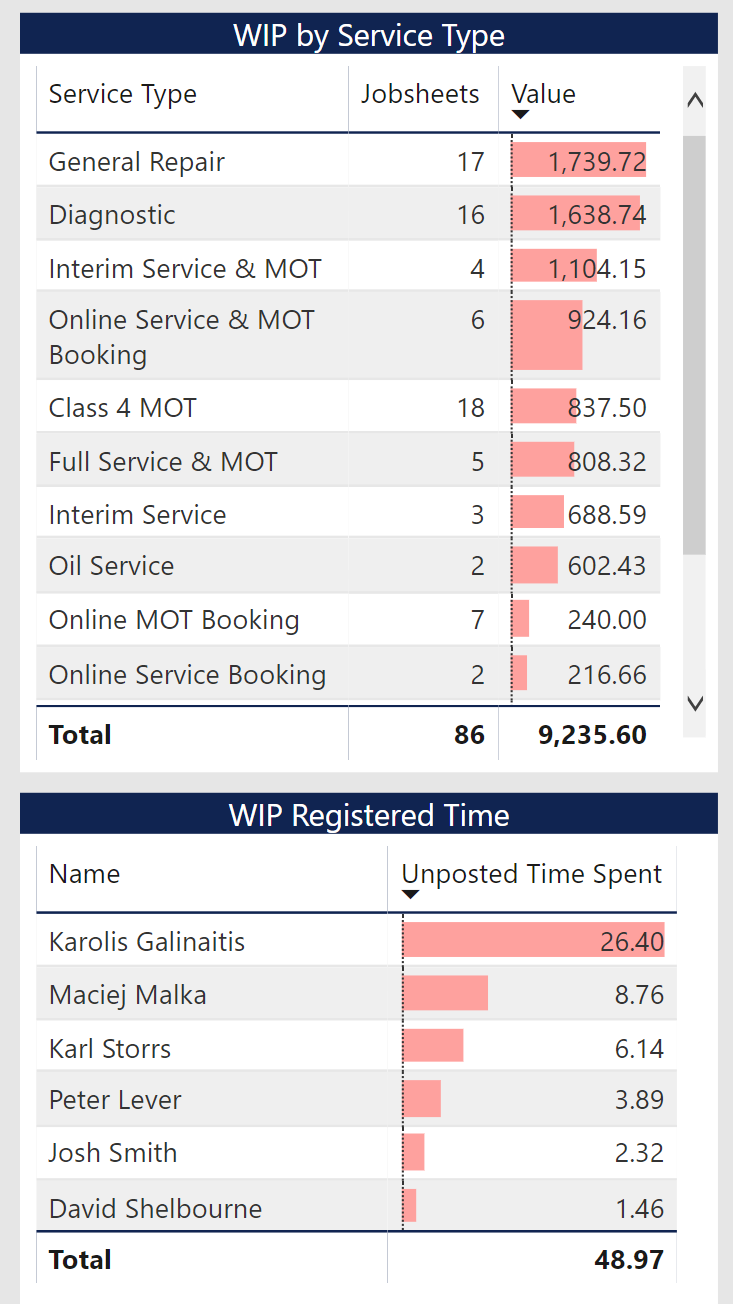
- WIP Analysis now displays unposted jobsheet time per technician, total days in WIP per jobsheet as well as the current unposted efficiency of each jobsheet.
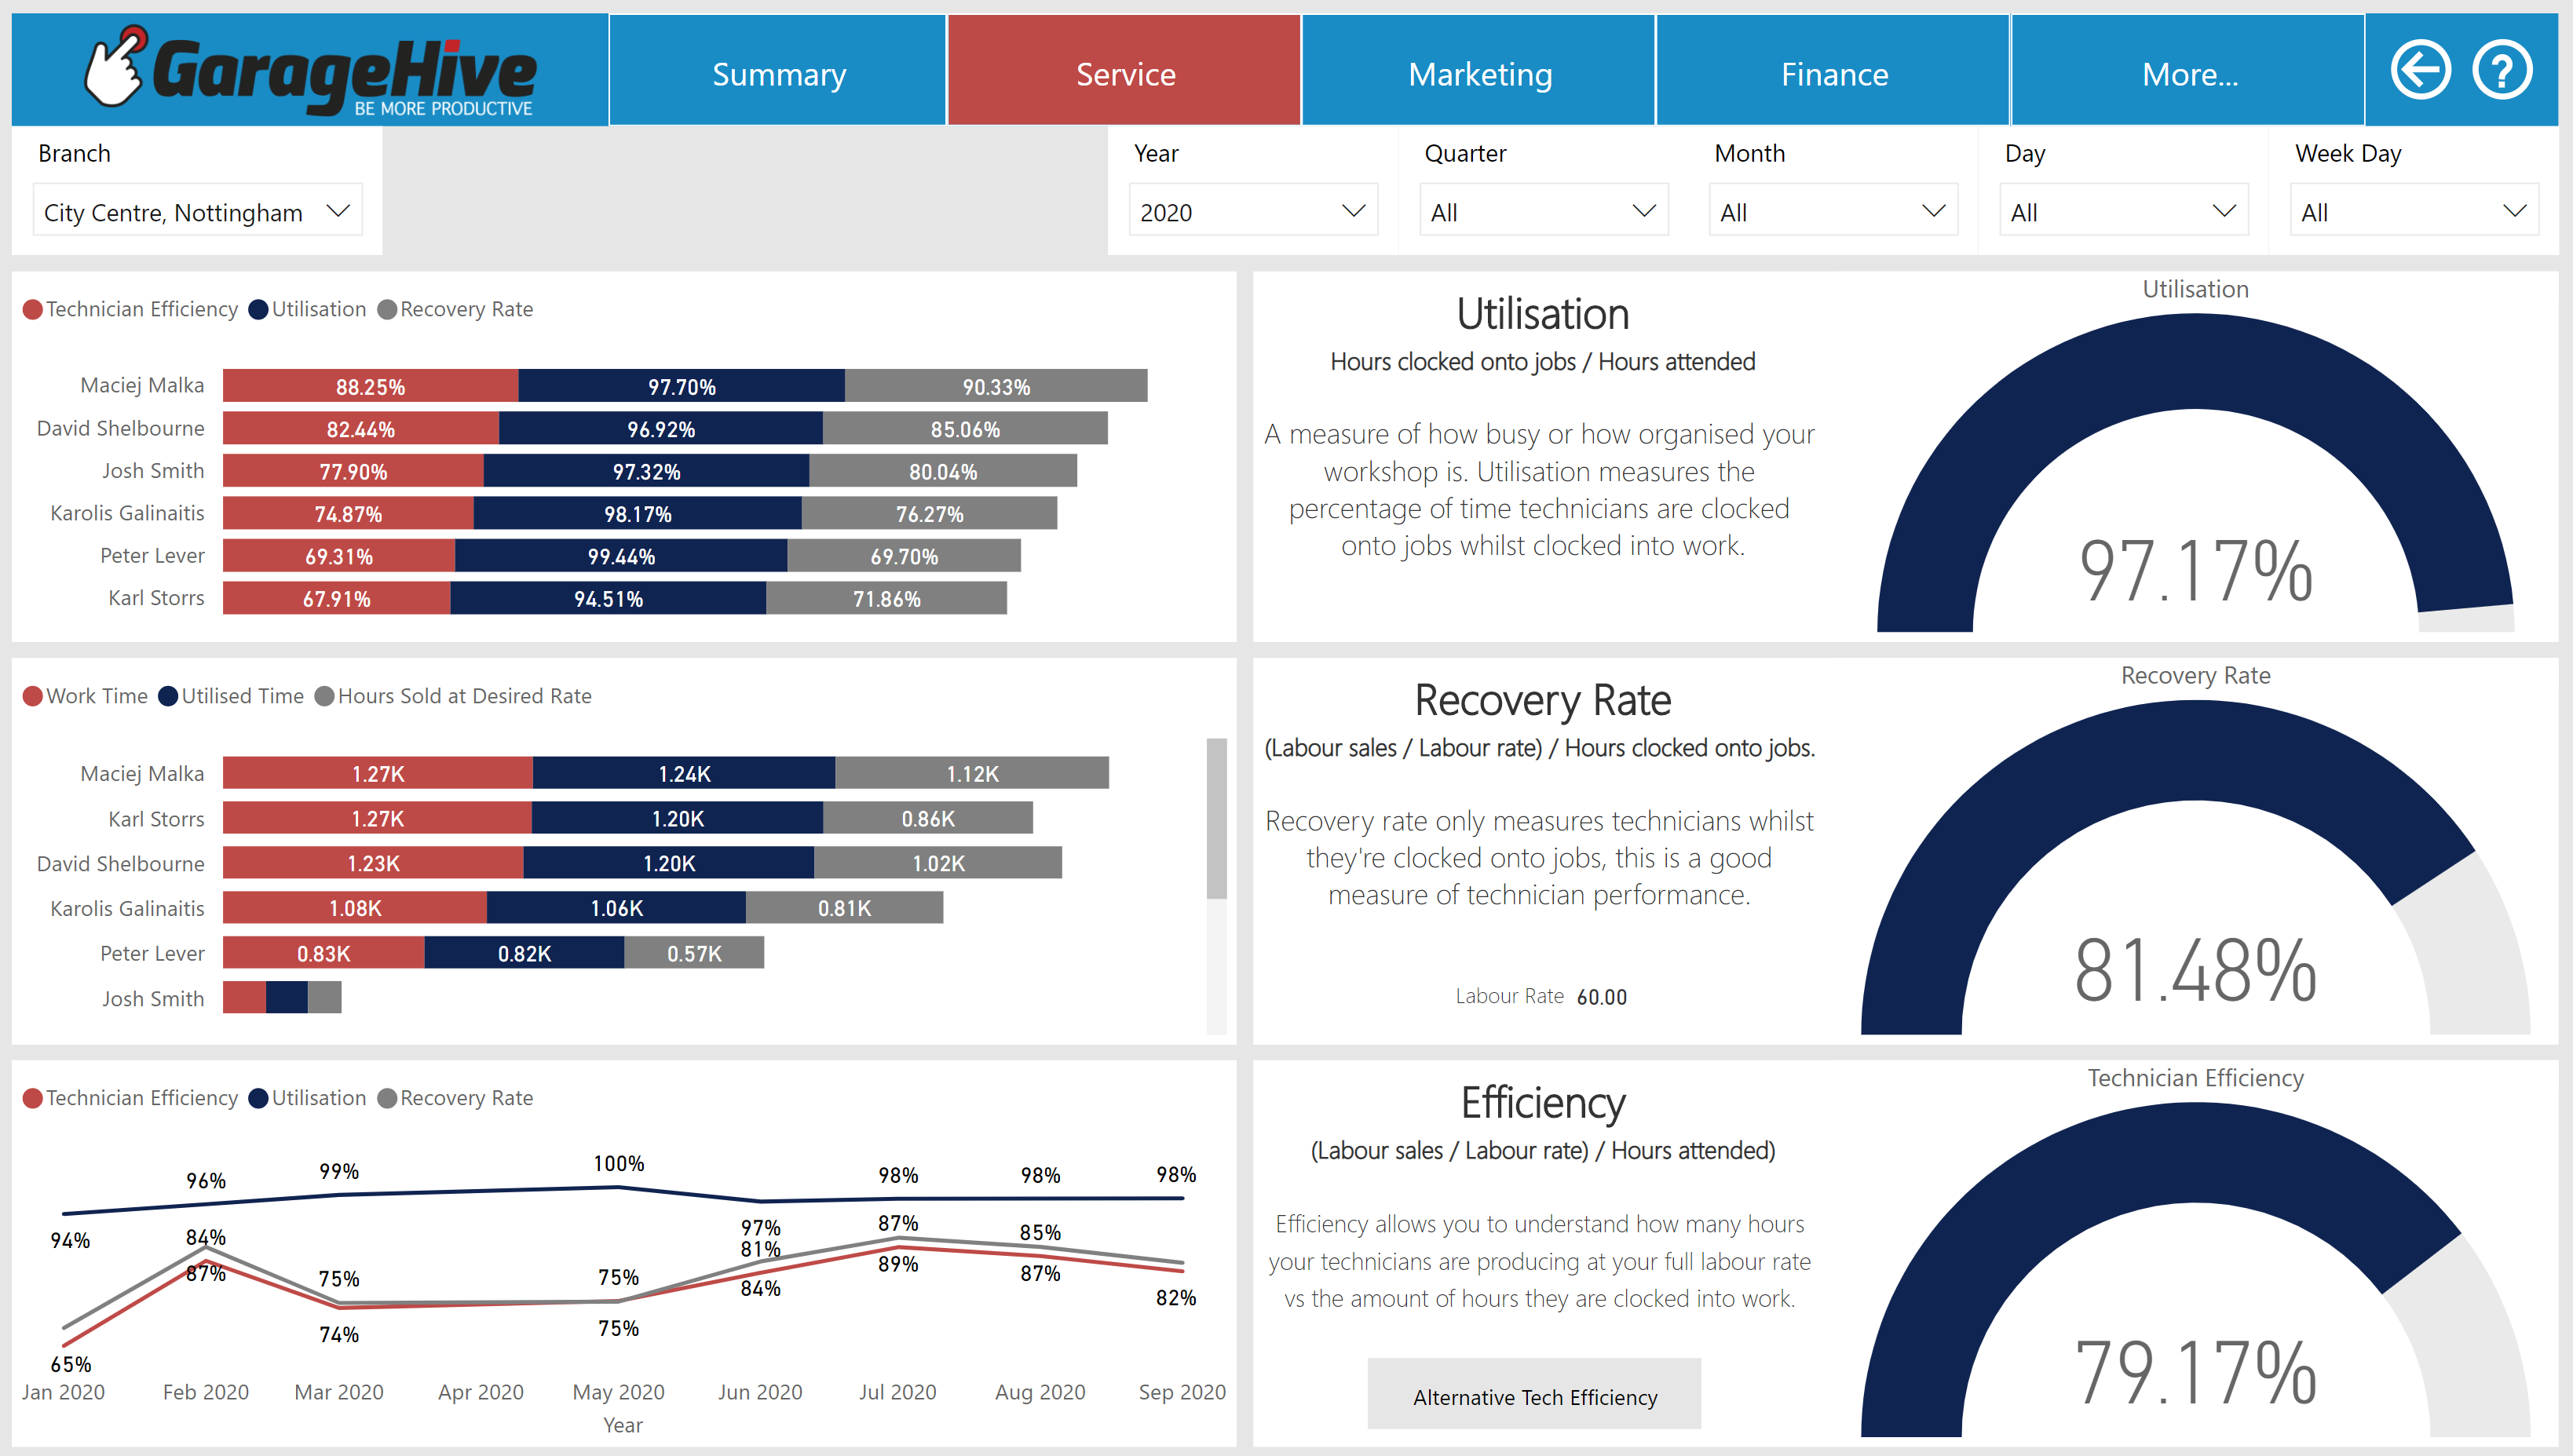
- Technician efficiency now also displays technician performance over time. We have also introduced an “alternative” technician efficiency report, allowing you to use alternative calculations to measure efficiency.
- Labour Analysis report has been simplified, added a pie chart to visualise the type of labour going through your workshop as a percentage.
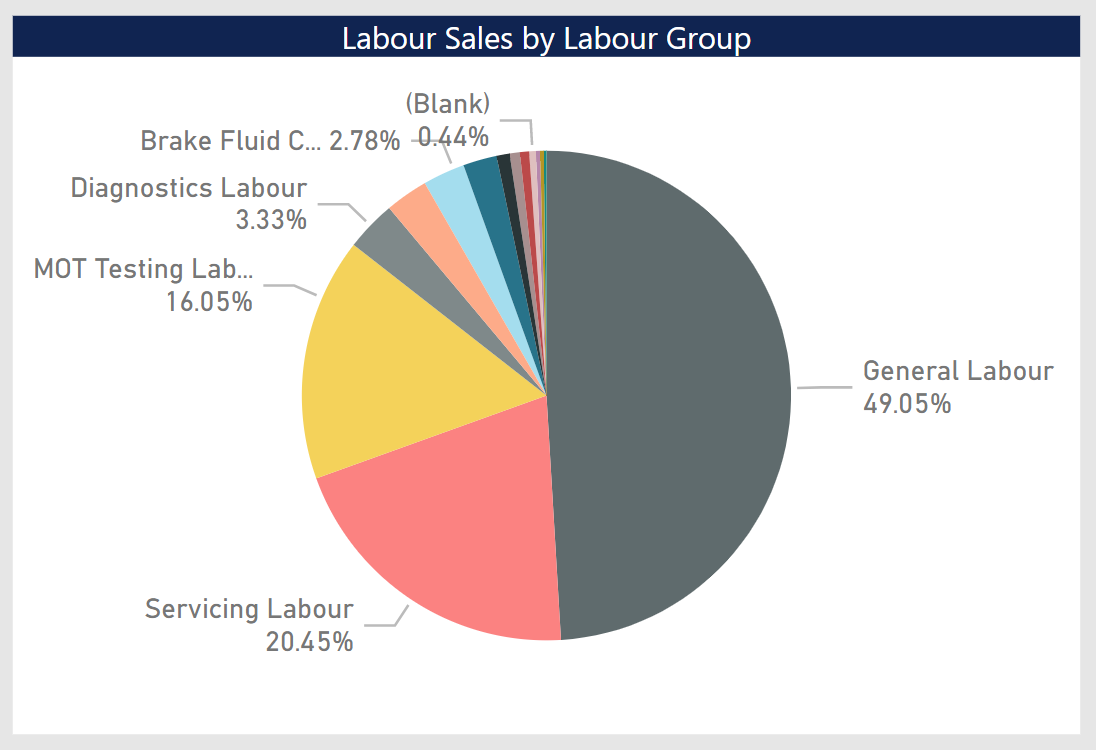
- Jobsheet Analysis can now be filtered by a technician, allowing you to see individual jobsheet performance per technician.
- Service advisor analysis has been greatly improved, giving you the ability to see the gross profit, jobsheet efficiency, averages and much more per service advisor.
- Marketing channel report has been improved, see the key KPIs per marketing channels such as profit margins and average invoice values.
Added 3 new Embed reports
We have re-designed the embed reports that are designed to be used with the embed feature within the Garage Hive role centres.
- Embed Summary – View the key KPIs and switch between date ranges.
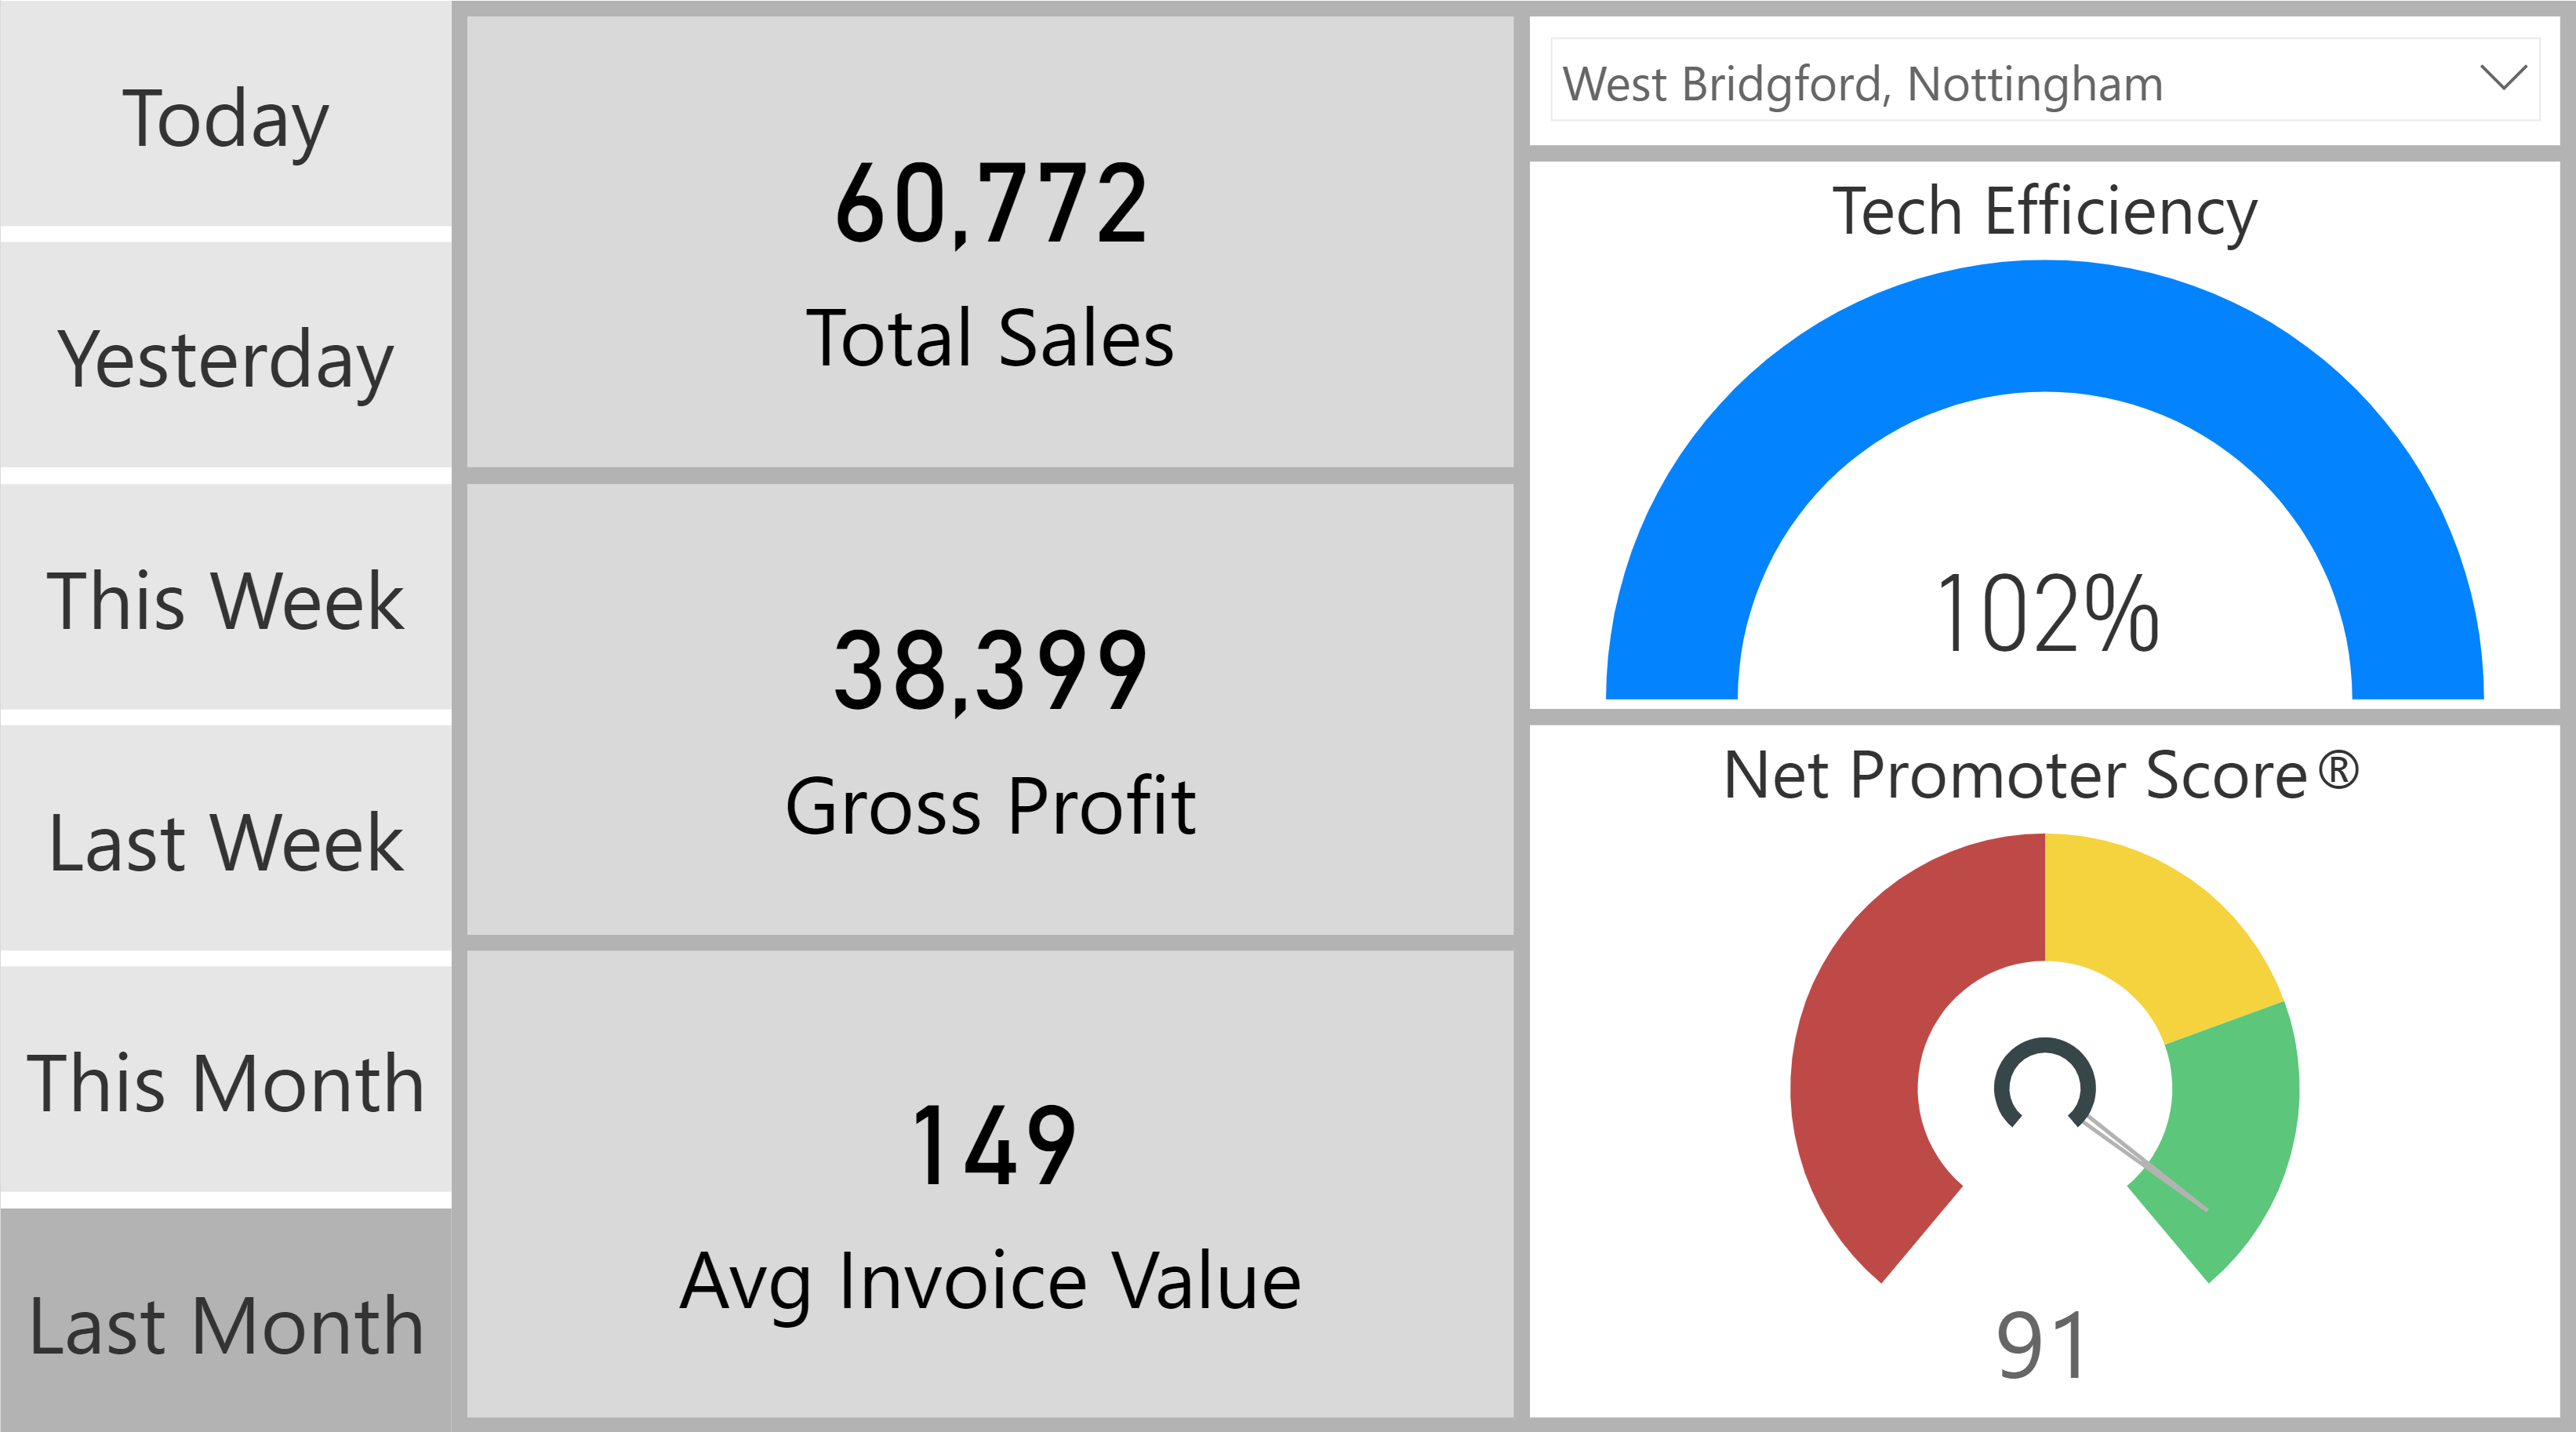
- Embed Technician – View technician utilisation and efficiency data that can be viewed across multiple date ranges.
- Embed Branch – Compare branch performance across various date ranges.
We hope you enjoy the changes to the Power BI app, as always it’s a constant work in progress and we look forward to adding additional reports and improving existing ones – We look forward to your feedback.
If your system has been updated to the latest platform you can install the latest Power BI app right away, please watch the video below to learn how.
This is the link to download the latest Power BI App
IMPORTANT – ONLY INSTALL IF YOUR SYSTEM HAS BEEN UPDATED TO BC16
https://app.powerbi.com/Redirect?action=InstallApp&appId=739eb02b-643e-4bc3-a9ae-61191a89452d&packageKey=75bab30b-2356-46b7-9b1a-e6f24c7cfa1b3HaU-ZnUnGsYGRP45f1y4cE1bkQgcQ6AIvIFeSuGZ-I&ownerId=1bde89ad-b4ce-45df-a919-e1e08e47294d&buildVersion=10
Copy link
